


South African Shelduck
Tadorna cana

Number Of Mature
Individuals (Regional)
17 000

Regional
Population Trend
Decreasing
2025
Regional Category
Least Concern
Search by species
CONTENTSOverview
Names
|
IOC English Name: |
South African Shelduck |
|
SA & IOC Scientific Name: |
Tadorna cana |
|
BirdLife International Taxonomy (scientific name): |
Tadorna cana |
|
Order: |
ANSERIFORMES |
|
Family: |
Anatidae |
|
Species name author: |
Gmelin 1789 |
|
Afrikaans: |
Kopereend |
|
Sesotho (South Africa): |
letata-hlohoputswa |
|
Sesotho (Lesotho): |
letata-hlooputsoa |
|
Siswati: |
|
|
Zulu: |
idadelibomvu |
Current Assessment Status
|
2025 Regional Category [Criteria] |
LC |
|
2024 Global Category [Criteria] |
LC (BirdLife International 2016) |
|
Population size (Regional) |
c. 17 000 mature individuals |
|
Population size (Global) |
30 000 individuals (Wetlands International 2024) which equates to 20 000 mature individuals |
|
Distribution size (EOO) (Regional) km2 |
1 217 178 (Lee 2024) |
|
Distribution size (EOO) (Global) km2 |
2 160 000 (BirdLife International 2016) |
|
Distribution size (AOO) (Regional) km2 |
624 207 (431 119 – 753 001) (BIRDIE 2024) |
|
Generation time |
10.9 years (BirdLife International 2016) |
|
Status change reason |
No change |
|
Migrant (in the region) |
Resident |
|
Regional endemic |
No |
Historic Listing Information
|
2000 Regional Status |
LC |
|
2015 Regional Status |
LC |
|
Status change reason (if applicable) |
Not applicable |
|
2015 Population size (Regional) |
Unknown |
|
2015 Global Status |
LC |
Reason for Inclusion
Reason for Inclusion in the Assessment
This species was not previously assessed. Preliminary screening of Coordinated Waterbird Counts (CWAC) data indicated a significant decline in number of South African Shelduck Tadorna cana counted per year (Lee 2024).
Category Justification
Category Justification
The South African Shelduck has been assessed as Least Concern at the regional level. The species’ Extent of Occurrence (EOO) is approximately 1 217 178 km², significantly exceeding the threshold of 20 000 km² required for classification as Vulnerable under Criterion B. Additionally, the Area of Occupancy (AOO) is estimated at 624 207 km², well above the 2000 km² threshold. The regional population is estimated at 17 000 mature individuals, surpassing the minimum of 10 000 individuals required for Vulnerable category under Criterion C.
Population trend data, including reporting rates from the second Southern African Bird Atlas Project (SABAP2), indicate a probable increase in population, and no substantial declines have been detected. Although localised wetland counts suggest some population declines, these are not considered representative of the species’ overall status, although historic declines are evident. The available evidence suggests a currently stable or weakly increasing population across the region, justifying the Least Concern status.
In conclusion, the species’ large distribution, stable population size, and lack of significant regional threats support its assessment as Least Concern.
Population Justification
The global population size is unknown (BirdLife International 2024) but likely exceeds 30 000 individuals (c. 20 000 mature individuals), as estimated by Wetlands International (data collected mostly from South Africa for the period 2015-2019).
Regionally, surveys carried out on 146 wetlands as part of the CWAC estimated the population for these sites to be 3573. Considering the small sample size of wetlands and that several moult sites counted by Geldenhuys (1981) e.g. Krugersdrift and Tierfontein which had over a thousand individuals between 1972 and 1977 are not included in the surveys, this figure is a severe underestimate of the regional population.
It is postulated that the Botswana population is relatively small given that this species occurs only along the south-eastern edge of the country and is not found in the Okavango River catchment. Brown et al. (2017) estimated the Namibian population to be 15% of the total population. Considering that the best estimate of the global population is 30 000, the South African population is estimated to be 25 000 (c. 17 000 mature birds).
Trend Justification
Globally the species is considered to be increasing (BirdLife International 2016). The regional population which constitutes more than 80% of the global population is also considered to be increasing based on international assessments as well as the increase in probability of reporting rates and increase area of occupancy.
Four analysis pathways were used to determine population trends.
- Reporting rates from SABAP2 were used as a proxy for population size, with the reasoning that higher numbers would result in higher reporting rates. Modelling the probability of reporting a species accounting for season, BirdLasser effects, if all habitats were surveyed, sampling hours and with pentad or observer as random effect, detected with high confidence a significant increase in the probability of reporting rates.
- Data collected for SABAP2. This is presence absence data collected per pentad (grid approximately 9 km x 7 km) for the entire region. Data from the project was divided into two periods (2007-2014 and 2015-2023) and static models were used to predict the number of pentads species could occur in within each period (Figure 2). The models predicted an increase in the AOO between the two periods of 0.9% (Lee 2024). Using the same data and available habitat per year, the number of pentads in which the species could occur were predicted annually between 2008 and 2022. Data emanating from these dynamic models (BIRDIE 2024) estimated that the AOO declined 49.8%.
- State-spaced models were applied to population counts carried out at 146 wetlands across the region to estimate the true number of individuals at each wetland. The data predicted a population decline of 12.8% over a 33-year period for these wetlands (BIRDIE 2024).
- CWAC data excluding outlier counts (>500) and using a Generalized Additive Model implemented with the poptrend package in R estimated percent change for the period 2003 to 2023 (three generations) as 24% (Figure 1, 96% CI: -18%, 90%). A linear model based on the top 20 most counted sites suggested annual change of -5% (95% CI: -7 to -2%) across the 1998-2023. Counts in the late nineties were higher than they are now, pointing to a historic decline.
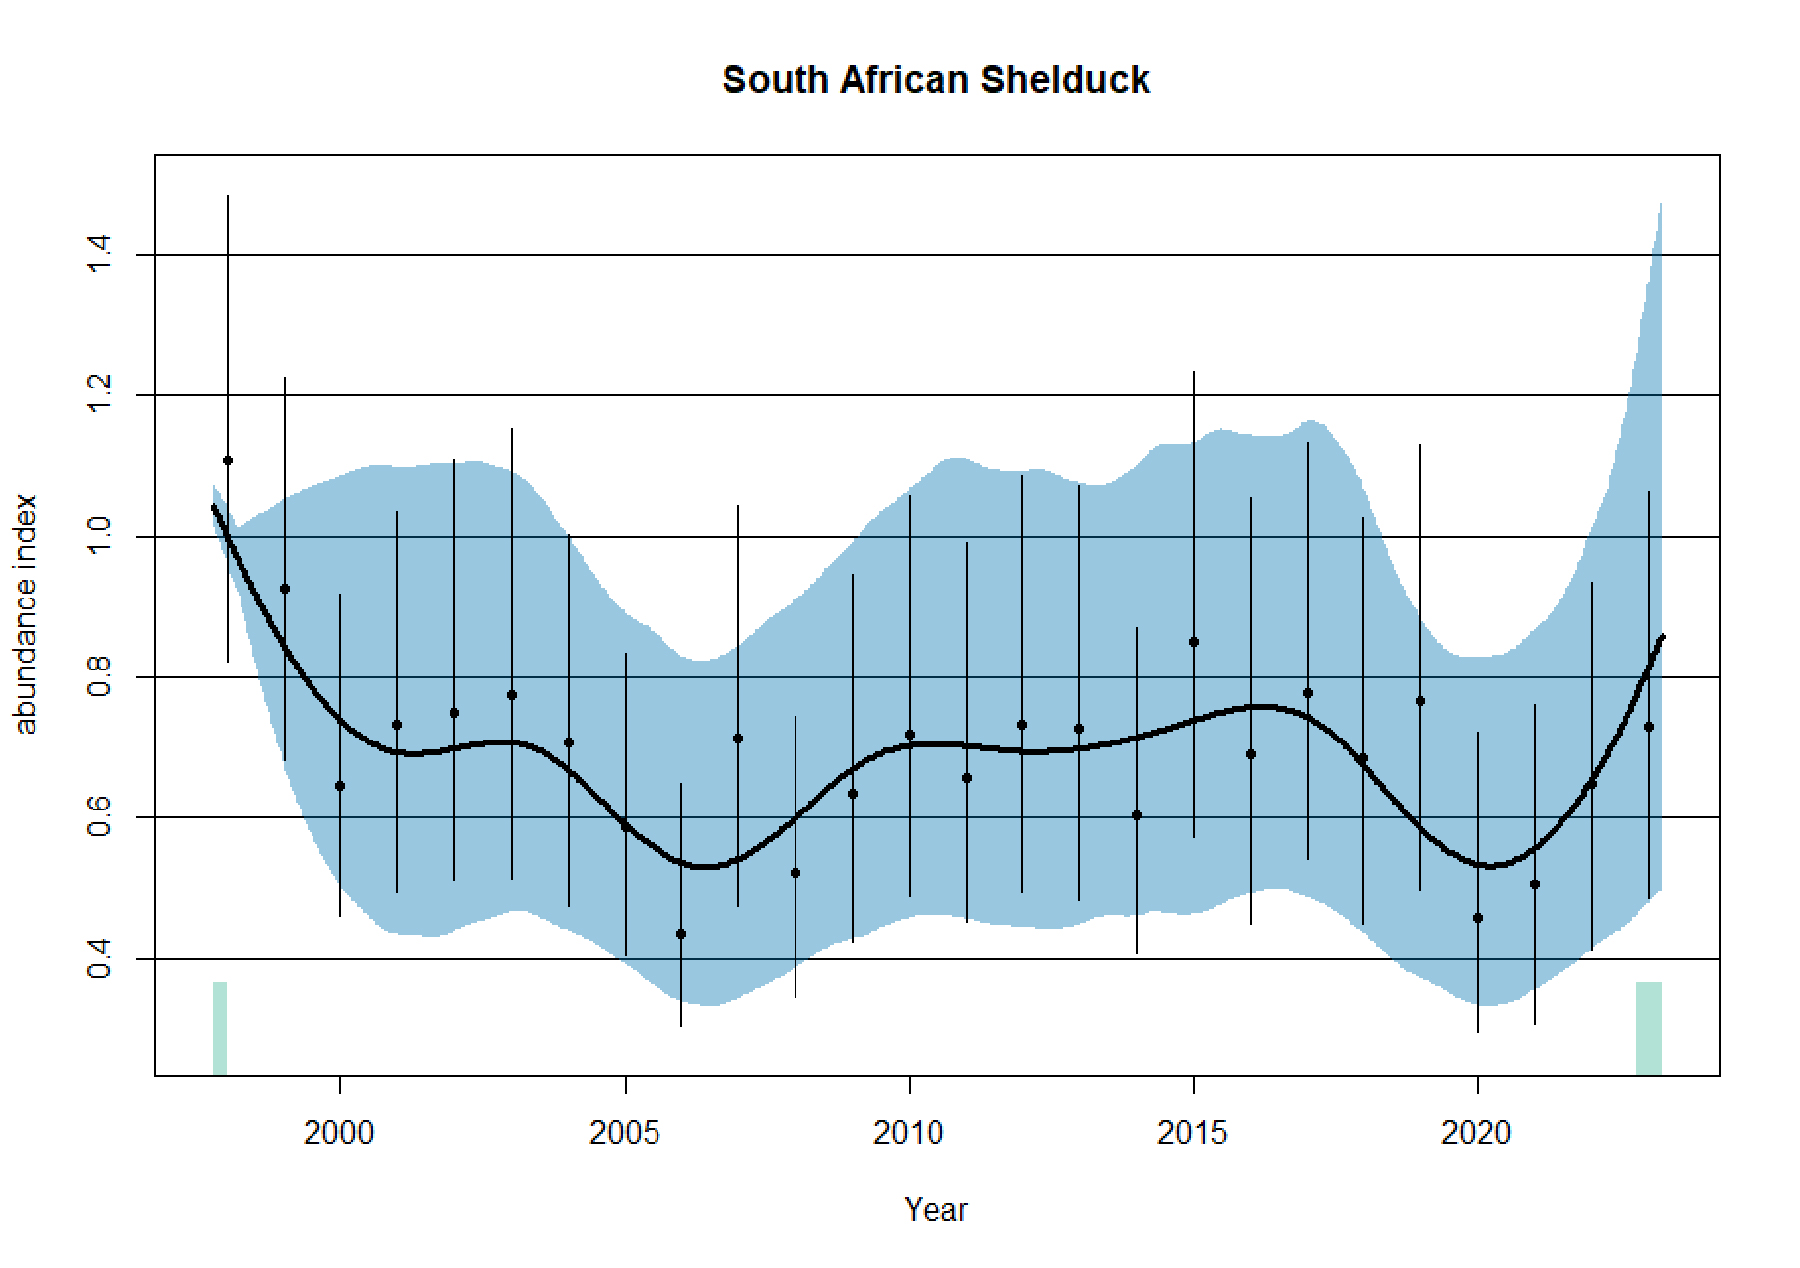
Figure 1: Population trend from CWAC data using a GAM model implemented using the poptrend R package, using count data filtered to <1000 to remove outliers.
The reporting rates from BirdLasser indicated an increasing probability of reporting rates intimating an increasing population. The state spaced models predicted a decline in population numbers but only for 146 wetlands for which there was sufficient data. Considering the widespread distribution of the species within the region (Figure 2) it is probable that these wetlands are not a representative sample size. The data from the dynamic models varied substantially between years and the confidence in the percentage decline obtained is low. Although CWAC analysis predicted a decline, these may have been due to values of >1000 for some counts, including 6447 for Deelpan from 2002, presumed to be an error. Excluding extreme values (>500) suggests no significant population decline. The static models indicating an increase in AOO produced the only figure for which there is a relatively moderate level of confidence.
In addition to being globally considered to be in decline, Wetlands International (2024) indicate with reasonable confidence that the population is declining, based on survey data (almost exclusively from South Africa) analysed by van Roomen et al. (2018) and Nagy and Langendoen (2020). Specifically, van Roomen et al. (2018) showed that for population data collected between 1996 and 2017, there was a decline but were uncertain whether the decline was more than 5% per year. Trend analysis based on the same data but for the period 1967-2018 by Nagy and Langendoen (2020) showed similar results. The latter authors did indicate that there was insufficient data to calculate population change over three generations. However, based on the trend for data between 1992-2018 the population was projected to decrease by 55% in 30 years (three generations) and a decline of 69% based on the growth rate of the last 10 years (2009-2018) compared to population levels in 2009. It must be noted that the data used by Nagy and Langendoen, and van Roomen et al., is from the same data set that was used in the dynamic models above. It is unclear how the data were used and whether the growth rate was due to population declines or depicts the decline of survey effort (less sites been monitored each year) over the period. Also, for a species that is highly mobile, the number of sites from which the data were collected is not a representative sample size, probably resulting in the fluctuating trends noted in the analysis. The confidence in the results from these analyses is therefore low.
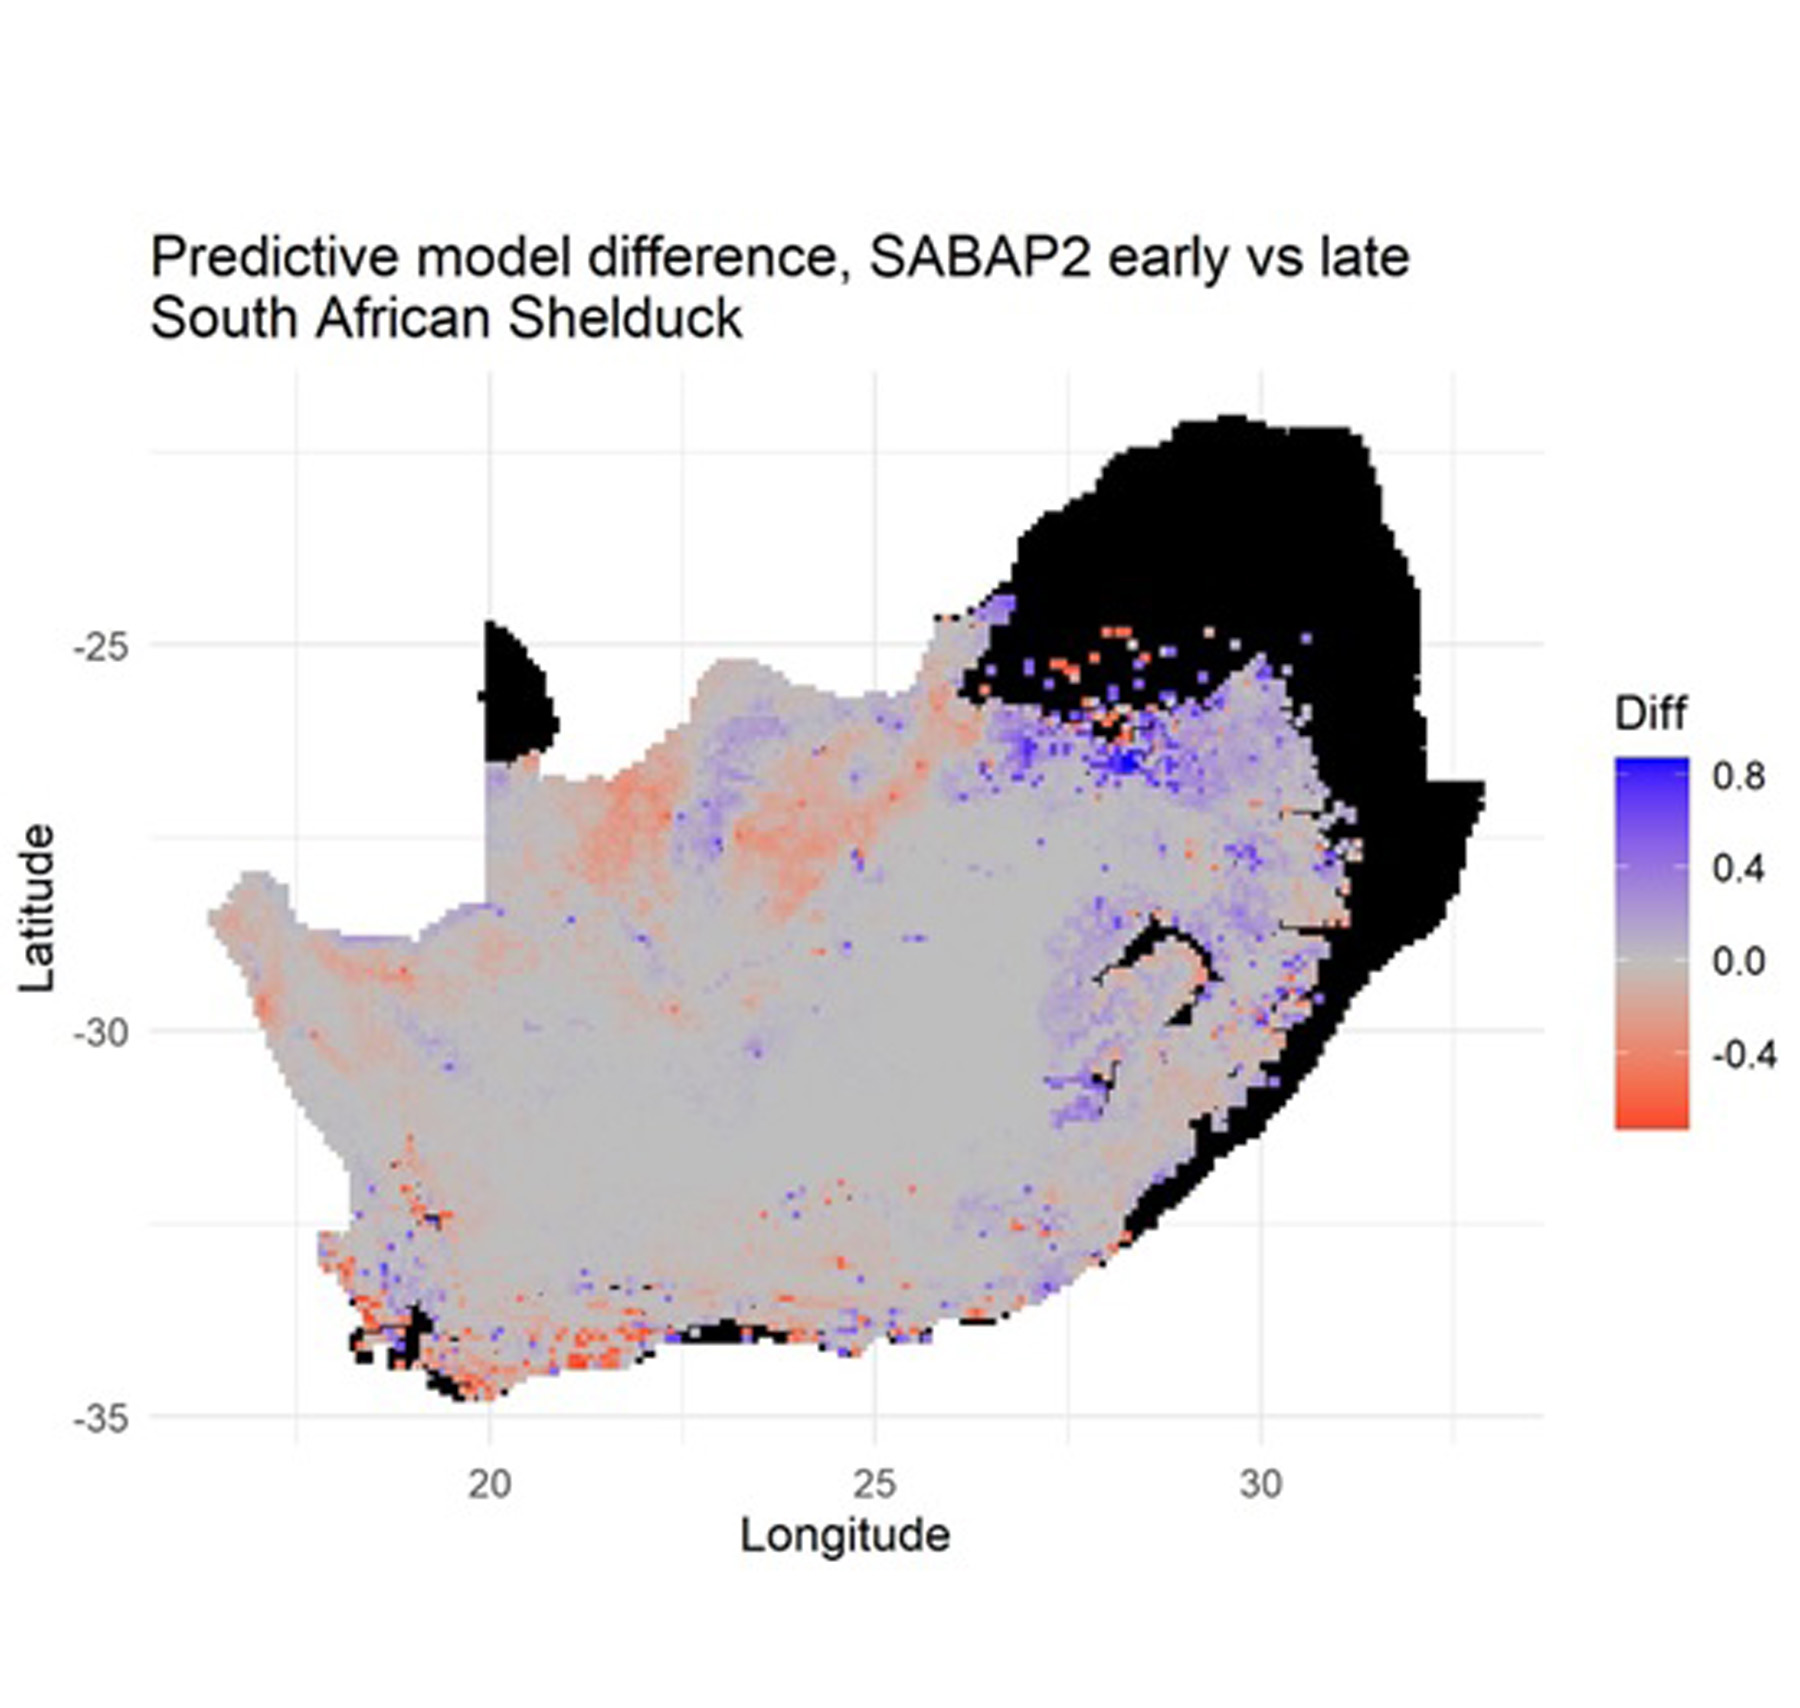
Figure 2: Predictive occurrence model results comparing data from 2007-2015 and 2016-2023. Red indicates a lower probability of recording for the latter period while blue indicates a higher recording (from Lee 2024).
Biology & Ecology
Taxonomy
Monotypic
Identification
61– 64 cm (Hockey et al. 2005). Sexes are dimorphic in plumage colouration (Hockey et al. 2005). Both sexes have a russet-coloured body with slate grey necks (Hockey et al. 2005). The entire head of the male is grey while the female has a variable amount of white on the face (Hockey et al. 2005). Legs and feet are dark grey; bill is black with dark brown eyes (Hockey et al. 2005). The secondary feathers of the male are tinged with green above, which often shows as a green patch in the wing (Hockey et al. 2005).
Distribution
Primarily occurs in South Africa, mainly in the southern Free State, Western, Northern and Eastern Cape (Hockey et al. 2005, Allan 2023). Also occurs in central and southern Namibia, southeast Botswana (Hockey et al. 2005, Allan 2023). Vagrants occur in Zimbabwe and Swaziland (Allan 2023).
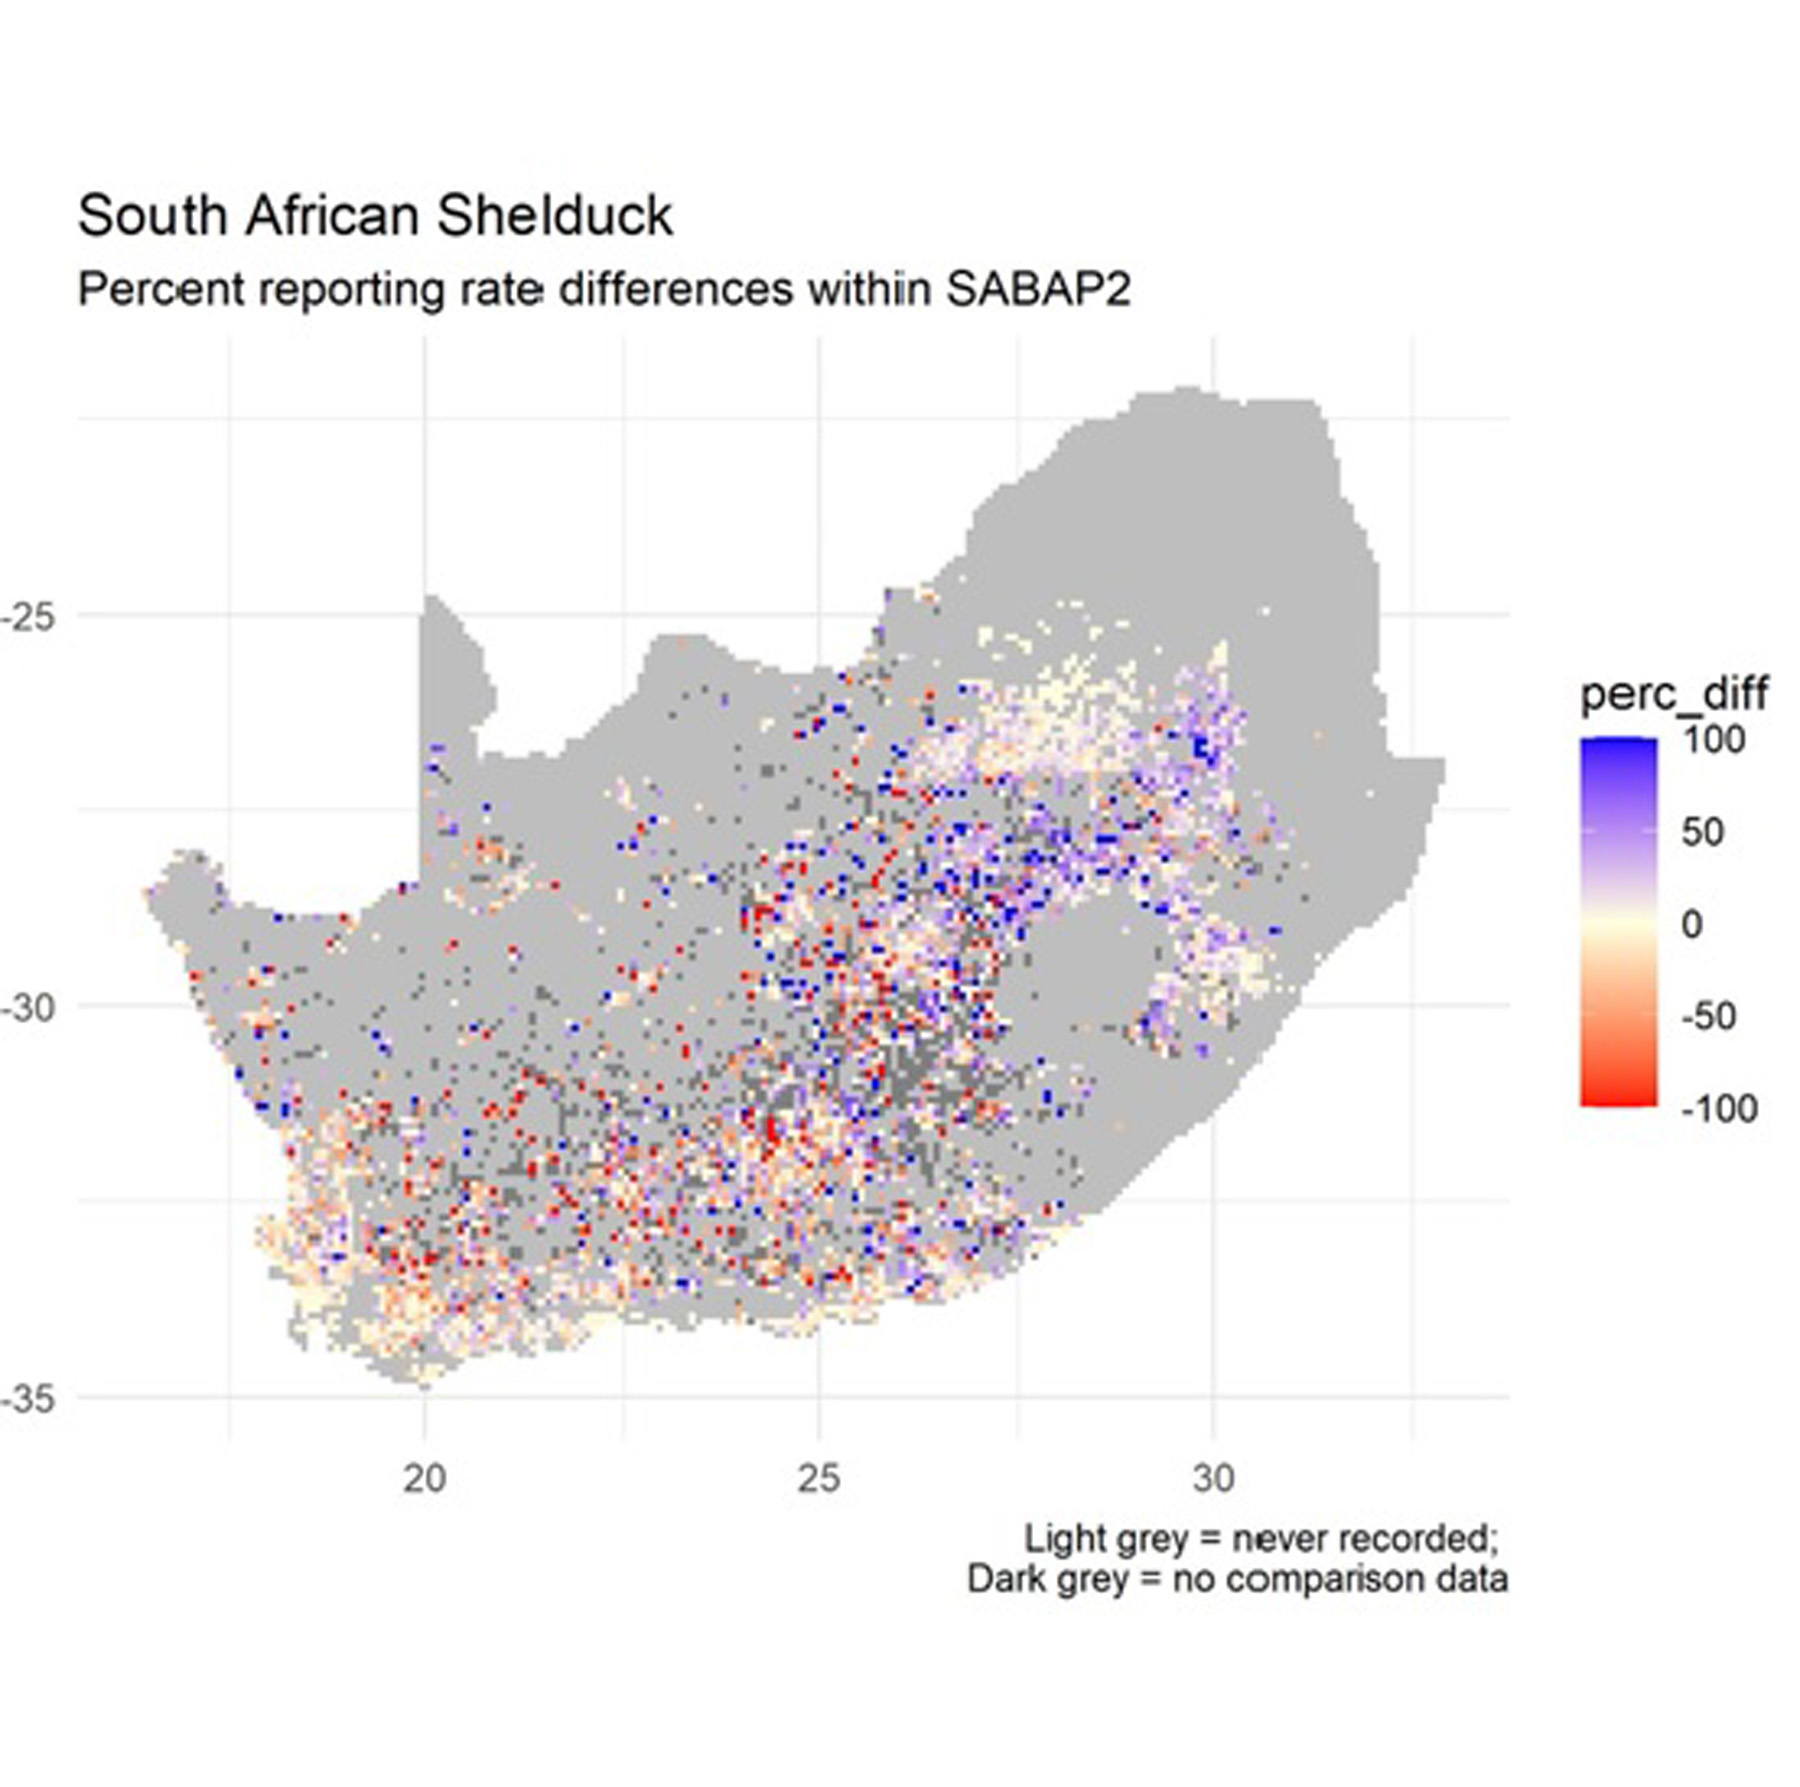
Figure 3: Distribution map of South African Shelduck also showing pentad level change between SABAP2 periods 2007-2015 and 2016 and 2023 (from Lee 2024).
Ecology
During the breeding season the South African Shelduck inhabit small permanent, shallow brackish and freshwater bodies of water with exposed muddy banks, including estuaries, sewage farms and farm dams (Taylor et al.1999). Geldenhuys (1976) showed that the species prefers short vegetation with an unobstructed view of the surrounding area.
Non-migratory but do undertake local “moult migrations” where birds travel from scattered breeding localities to larger waterbodies to moult (Oatley et al. 1986). The longest distance recorded for the species was 1075 km, and there are 12 more recoveries from the 393 recoveries, exceeding 900 km (Underhill et al. 1999). Oatley et al. (1986) described this species as a medium-distance disperser.
Usually a solitary, territorial nester (Geldenhuys 1980a). Breeding time is March–December but mostly June–September with marked peak in July–August (Winterbottom 1968, Siegfried 1976, Tarboton et al. 1987, Jarvis et al. 1999). The nest is usually in a hole in the ground, typically made by aardvark or springhare, but also porcupine or holes in haystacks or amongst rocks (Horsbrugh 1912, Tarboton 2001). Clutch size 7–11 eggs (Edelsten 1932, Delacour 1954, Maclean 1993, Tarboton 2001) and incubated by female for about 30 days (Siegfried 1976, Geldenhuys 1980b), while the male stands guard nearby (Geldenhuys 1980a). Fledgling period is about 10 weeks with young tended by both sexes (Tarboton 2001). Mortality is averaged to 13 years with five additional records less than five years (Underhill et al. 1999).
Breeding success: The breeding success of the species is generally high, with an average of 5.0 young reared to fledging per year and 86% of pairs breeding successfully (Geldenhuys 1980a). The species is typically single-brooded but can replace lost broods of small chicks (Geldenhuys 1980b, Taylor 1944). Brood sizes range from 1 to 21, with mean sizes of 7.6 at Graaff-Reinet (Eastern Cape) (Taylor 1944) and 7.4 at one week in the Free State, decreasing to 5.8 at fledging (Geldenhuys 1980a). Larger broods tend to have lower chick loss rates (Geldenhuys 1980a). Survival to fledging is slightly higher in the Karoo (76.4%) compared to grassland areas (71.5%) (Geldenhuys 1980a). Breeding burrows may flood and collapse during heavy rain (Skead and Dean 1977).
Natural food consists of benthic invertebrate fauna ingested mainly at receding water of shallow brackish wetlands and submerged aquatic plants occurring in shallow wetlands. Agricultural waste material although not available to breeding pairs and broods is utilised by the species especially during the non-breeding period and is a more consistent food source than natural food which can be subject to drastic annual changes (Geldenhuys 1977). The ability to exploit this artificial food source may also partly explain why South African Shelduck are capable of using relatively unproductive wetlands as moult localities (Geldenhuys 1981).
Threats & Conservation
Threats
Van Jaarsveld et al. (1999) indicated that the South African Shelduck may come under threat through ranges shifts as a result of climate change. Geldenhuys (1981) intimated that human disturbance at the impoundments where birds congregate to moult could have an impact on the populations. Blaker (1967) and van Heerden (1974) both reported mortalities of this species due to avian botulism and therefore may be threatened by future outbreaks of the disease. The species is also hunted for sport, but there is little evidence that this poses a threat (Little et al. 1995). Geldenhuys (1977) indicated that famers occasionally reported that Shelduck were responsible for damage to croplands. This could result in wildlife conflict and ultimately become a potential threat. A disaster happening at any one of the limited number of localities on which this species concentrates during the moulting period may have severe consequences for the population (Geldenhuys 1981).
Conservation Measures Underway
In those provinces where South African Shelduck is allowed to be hunted, stipulated hunting seasons and bag limits are set as per the hunting regulations. Certain important waterbodies that contain at least 1% of the regional population (e.g. De Hoop Nature Reserve, and Voelvlei dam in the Agulhas National Park in the Western Cape Province) occur within protected areas. Other important wetlands that also hold more than 1% of the regional population are proclaimed Ramsar sites (e.g. Orange River Mouth).
In addition, the species is listed under the African Eurasian Waterbird Agreement (AEWA) which is an intergovernmental treaty dedicated to the conservation of migratory waterbirds and their habitats developed under the framework of the Convention on the Conservation of Migratory Species of Wild Animals (CMS). This treaty which covers Africa, Europe, the Middle East, Central Asia, Greenland and the Canadian Archipelago places an obligation on signatory countries, of which South Africa is one, to conserve migratory waterbirds and their habitats.
Conservation Measures Proposed
- Hunting regulations will require deliberation, taking into consideration the difference in population size between provinces and probably different breeding seasons.
- It is speculated that not all sites containing this species are surveyed and possibly some sites that were counted in the past are not surveyed anymore. Resuming surveys of previously surveyed sites and expansion of monitoring to cover all important wetlands for this species is recommended enabling a more thorough investigation into population trends. A more effective method of determining population size would be to do surveys during the moulting period on where they concentrate in large numbers on relatively fewer impoundments. Population trends for this species are uncertain, making red list assessments difficult.
- Evaluate/address conservation actions at waterbodies where South African Shelduck concentrate during the moulting period.
- Improve adoption of the 1% criterion to identify key sites for conservation action – this is especially important for this species as a large number of known sites meeting the 1% criteria are storage dams and/or large pans on private properties (e.g. Danielskuil pan). Some of the dams are within proclaimed nature reserves, but the dams themselves fall under the jurisdiction of the Department of Water Affairs (e.g. Bloemhof Dam surrounded by the Sandveld Provincial Nature reserve and the Allemanskraal Dam surrounded by the Willem Pretorius Provincial Nature Reserve, Free State Province). The current 1% value needs to be adjusted as it is based on a population of 50 000 mature individuals which is not the latest estimate according to Wetlands International.
- Increased and better recording of nesting via the Nest Record Card Scheme especially information regarding nest type, locality and nest success is important to understand the breeding ecology of the species.
Research Priorities and Questions
- Movement patterns within the Southern African region and how this can improve the conservation of the species – especially in the light of variation in hunting regulations between the provinces.
- Determine impacts of South African Shelduck on small grain agriculture.
- Determine whether there is a decline in both population numbers and AOO.
- Understand regional trends in availability of nest holes, breeding success, and the potential impacts of climate change and landscape modification on these. South African Shelduck may be more vulnerable than expected if aardvark and springhare populations are declining, nest predation increases, and/or hole availability is reduced by agriculture. Shifts in rainfall patterns may lead to nest destruction by flooding.
Contributors & References
Assessor/s
Kevin Shaw, Maria Paul
Reviewer/s
Graeme Cumming, Alan Lee
References
Allan DG. 2005. South African Shelduck Tadorna cana. In: Hockey PAR, Dean WRJ, Ryan PG (eds), Roberts – Birds of Southern Africa (7th Edn). Cape Town: Trustees of the John Voelcker Bird Book Fund.
Allan DG. 2023. South African Shelduck (Tadorna cana), version 2.0. In: Engelbrecht GD (ed), Birds of the World. Ithaca, NY: Cornell Lab of Ornithology. https://doi.org/10.2173/bow.soashe1.02
BIRDIE. 2024. An online platform for African wetland and waterbird data. https://biodiversityadvisor.sanbi.org/contentmanagement/index?guid=42305260-12b0-4a92-912e-7d801d15fdac. [Accessed on 8 September 2024].
BirdLife International. 2016. Tadorna cana. The IUCN Red List of Threatened Species 2016: e.T22680007A92838539. https://dx.doi.org/10.2305/IUCN.UK.2016-3.RLTS.T22680007A92838539.en. [Accessed on 26 April 2024].
BirdLife International. 2024. Species factsheet: Tadorna cana. Downloaded from https://datazone.birdlife.org/species/factsheet/south-african-shelduck-tadorna-cana [Accessed on 26 April 2024].
Blaker D. 1967. An outbreak of botulinus poisoning among waterbirds. Ostrich 38: 144–147.
Brown CJ, Mendelsohn JN, Thomson N, Boorman M. 2017. Checklist and analysis of the birds of Namibia as at 31 January 2016. Biodiversity Observations 8: 1–153.
Delacour J. 1954. Waterfowl of the World. Vol. 1. London: Country Life.
Edelsten G. 1932. Notes on the nest of the South African Shelduck. Ostrich 3: 61.
Geldenhuys JN. 1976. Physiognomic characteristics of wetland vegetation in South African Shelduck habitat. South African Journal of Wildlife Research 6: 75–78.
Geldenhuys JN. 1977. Feeding habits of South African Shelduck. South African Journal of Wildlife Research 7: 5–9.
Geldenhuys JN. 1980a. Breeding ecology of the South African Shelduck in the southern Orange Free State. South African Journal of Wildlife Research 10: 94–111.
Geldenhuys JN. 1980b. Breeding seasons of Egyptian Geese and South African Shelducks in central South Africa. In: Johnson DN (ed), Proceedings of the 4th Pan-African Ornithological Congress. Johannesburg: Southern African Ornithological Society. pp 267–275.
Geldenhuys JN. 1981. Moults and moult localities of the South African Shelduck. Ostrich 52: 129–134.
Hockey PAR, Dean WRJ, Ryan PG (eds). 2005. Roberts – Birds of Southern Africa. (7th Edn). Cape Town: Trustees of the John Voelcker Bird Book Fund.
Horsbrugh B. 1912. The Game-birds and Water-fowl of South Africa. London: Witherby & Co. In: Johnson DN (ed), Proceedings of the 4th Pan-African Ornithological Congress. Johannesburg: Southern African Ornithological Society. pp 267–275.
IUCN. 2024. South African Shelduck Tadorna cana. The IUCN Red List of Threatened Species. Version 2023-1. https://www.iucnredlist.org. Accessed on 26 April 2024.
Jarvis AM, Robertson A, Brown CJ, Simmons RE. 1999. Namibian Avian Data Base. Unpublished. Windhoek: National Biodiversity Programme, Ministry of Environment & Tourism.
Lee ATK. 2024. Regional Red Data Book of the Birds of South Africa, Lesotho and Eswatini: SABAP2 Synthesis and Supporting Information and Graphics for South African Shelduck. Unpublished report. Johannesburg: BirdLife South Africa.
Little RM, Vester KC, Crowe TM. 1995. Temporal and spatial patterns of breeding activity of 12 duck species (Anatidae) in the Cape Provinces, South Africa, and their implications for hunting seasons. South African Journal of Wildlife Research 25: 17–22.
Maclean GL. 1993. Roberts’ Birds of Southern Africa (6th Edn). Cape Town: John Voelcker Bird Book Fund.
Nagy S, Langendoen T. 2020. Flyway Trend Analyses Based on Data from the African Eurasian Waterbird Census from the Period of 1967-2018. Online publication. Wageningen, The Netherlands: Wetlands International.
Oatley TB, Prys-Jones RP. 1986. A comparative analysis of movements of southern African waterfowl based on ringing recoveries. South African Journal of Wildlife Research 16: 1–6.
Skead DM, Dean WRJ. 1977. Seasonal abundance of Anatidae at Barberspan. Ostrich Suppl. 12: 49–64.
Siegfried WR. 1976. Sex ratio in the Cape Shelduck. Ostrich 47: 113–116.
Tarboton WR, Kemp MI, Kemp AC. 1987. Birds of the Transvaal. Pretoria: Transvaal Museum.
Tarboton W. 2001. A Guide to the Nests & Eggs of Southern African Birds. Cape Town: Struik Publishers (Pty) Ltd.
Taylor JS. 1944. Notes on the South African Shelduck. Ostrich 15: 188–193.
Taylor PB, Navarro RA, Wren-Sargent M, Harrison JA, Kieswater SL. 1999. Total CWAC Report: Coordinated Waterbird Counts in South Africa, 1992-1997. Cape Town: Avian Demography Unit.
Underhill LG, Tree AJ, Oschadleus HD, Parker V. 1999. Review of Ring Recoveries of Waterbirds in Southern Africa. Cape Town: Avian Demography Unit, University of Cape Town.
van Heerden J. 1974. Botulism in the Orange Free State Goldfields. Ostrich 45: 182–184.
van Jaarsveld AS, Chown SL, Erasmus BFN, Kshatriya M, Wessels KJ. 1999. Vulnerability and adaption assessment of South African animal taxa to climate change. Biodiversity Monitoring Assessment Programme, University of Pretoria.
van Roomen M, Nagy S, Citegetse G, Schekkerman H (eds). 2018. East Atlantic Flyway Assessment 2017: The Status of Coastal Waterbird Populations and Their Sites. Wilhelmshaven, Germany: Wadden Sea Flyway Initiative p/a CWSS; Wageningen, The Netherlands: Wetlands International; Cambridge, UK: BirdLife International.
Wetlands International. 2024. Waterbirds Populations Portal. https://wpp.wetlands.org. [Accessed on 26 April 2024].
Winterbottom JM. 1968. A check list of the land and fresh water birds of the Western Cape Province. Annals of the South African Museum 53: 1–276.
Citation
Shaw K, Paul M 2025. South African Shelduck. In: Lee ATK, Rose S, Banda S, Bezeng SB, Maphalala MI, Maphisa DH, Smit-Robinson H (eds), The 2025 Red Data Book of Birds of South Africa, Lesotho and Eswatini. Johannesburg, South Africa: BirdLife South Africa. Available at: https://www.birdlife.org.za/red-list/south-african-shelduck/
Our generous sponsors


