


Our Scientific Approach and Assessment Methods
Search by species
Image © Dylan Vasapolli, Birding Ecotours
Search by species
CONTENTSThe 2025 Red Data Book of Birds of South Africa, Lesotho and Eswatini
Lee ATK, Rose S, Banda S, Bezeng SB, Maphalala MI, Maphisa DH, Smit-Robinson H (eds)
INTRODUCTION
The 2025 Red Data Book of Birds of South Africa, Lesotho, and Eswatini presents an updated, peer-reviewed assessment of the conservation status of bird species of concern occurring within South Africa (including the Prince Edward Islands), Lesotho, and Eswatini. This initiative was spearheaded by BirdLife South Africa (BLSA) in collaboration with the South African National Biodiversity Institute (SANBI) and numerous avian experts. Collectively, these countries (hereafter referred to as ‘the region’) harbour a remarkable diversity of bird species, including many endemics of significant global conservation interest.
The Red Data Book of Birds 2025 follows the International Union for Conservation of Nature (IUCN) Red List framework, adapted to a regional scale to reflect the unique environmental challenges and species diversity of Southern Africa. The assessments follow the globally recognised IUCN Red List categories and criteria, offering an evidence-based guide to the risks of extinction faced by avian species in the region.
This publication marks the fourth edition of the Regional Red Data Book. The inaugural list was published in 1976 (Siegfried et al. 1976), followed by subsequent ‘Red Data Books’ in 1984 (Brooke 1984), 2000 (Barnes 2000), and 2015 (Taylor et al. 2015). The 2015 ‘Eskom Red Data Book of Birds of South Africa, Lesotho and Swaziland’ established an essential baseline, identifying 132 species assessed as higher risk than Least Concern. This earlier edition emphasised threats such as habitat loss, pollution, collisions with infrastructure (e.g., powerlines), and invasive species. Since then, anthropogenic pressures have continued to impact bird populations and habitats, necessitating the comprehensive reassessment presented here, which draws methodologically and conceptually from the 2015 framework.
The three principal objectives guiding the Regional Red Listing process resulting in this resource are:
- Evaluate the risk of extinction of bird species within the region, identify contributing threats and mitigation measures.
- Share assessment outcomes to diverse decision-making and influencing entities, as well as the general public, in an easy and accessible manner as possible.
- Inform global Red List assessments coordinated by BirdLife International and the International Union for Conservation of Nature (IUCN), particularly concerning Southern African endemic bird species.
At a glance:
- How many species assessed?
A total of 739 species were assessed consistently for both the 2015 and 2025 assessments, of a potential pool of 887 species that have been recorded in South Africa.
- How many species are threatened?
In 2025, 147 species were classified as threatened or potentially threatened (higher risk than Least Concern), an increase from 132 species in the 2015 assessment.
- By group?
- Raptors: 21 species in categories NT or higher (including 1 Regionally Extinct, Egyptian Vulture)
- Waterbirds: 27 species in categories NT or higher
- Seabirds: 42 species in categories NT or higher
- Other terrestrial birds: 56 species in categories NT or higher
- Compared to 2015?
The overall number of threatened species increased from 132 to 147 between 2015 and 2025. Significant increases occurred in Near Threatened and Vulnerable categories, highlighting rising conservation concerns, particularly among waterbirds and terrestrial birds.
- Status change reasons?
Key reasons for status changes included genuine population declines or recoveries (51 species), improved data or analytical methods enhancing species assessments (16 species), error corrections (4 species), and taxonomic updates resulting in status adjustments (2 species). Persistent threats such as habitat degradation, invasive species, energy infrastructure collisions, climate change, and fisheries impacts were primary drivers of genuine declines.
METHODS
IUCN Criteria and Categories
The IUCN Red List provides a globally recognised framework for assessing the relative extinction risk faced by species. It employs quantitative criteria based primarily on measures of population size, trends in population decline, and the species’ geographic distribution. Each species is evaluated against standardised thresholds defined by these criteria, allowing assignment to one of seven categories (of the 11 potentially available, including Extinct and Data Deficient), ranging from ‘Regionally Extinct’ to ‘Least Concern’ (Bubb et al. 2009).
Species identified as being at significant risk of extinction are categorised into three principal threat levels: Critically Endangered (CR), Endangered (EN), and Vulnerable (VU). Collectively, any species assigned to any of these three categories is termed Threatened. The distinction among these categories is based on the severity of the extinction risk as determined by measurable criteria such as rapid population decline, restricted or fragmented distribution, or small and declining population size. Species that almost meets threatened level are categorised as Near Threatened (NT).
To qualify for one of these threatened categories, a species must meet or exceed quantitative thresholds outlined in at least one of five assessment criteria (Criteria A-E; see Table 1). These criteria assess different aspects of extinction risk, including population reduction rates, geographic range limitations, small population sizes combined with declines, extremely small or restricted populations, and quantitative analyses predicting the likelihood of extinction.
The assessments in this Red Data Book adhere to the rules and definitions specified in the most recent version of the IUCN Red List Categories and Criteria (Version 16; IUCN 2024, https://www.iucnredlist.org/resources/redlistguidelines). While the 2015 assessment was self-described as ‘precautionary’, for terrestrial species with long running datasets, such as SABAP2, to draw on, this assessment cycle could be better described as evidentiary, with some exceptions where data quality was too poor or contradictory.
Table 1 A very simplified summary of the IUCN Red List criteria for threatened categories (Critically Endangered, Endangered, Vulnerable). The detailed version with the important qualifiers is available here: https://www.iucnredlist.org/resources/summary-sheet
| Criterion | Description | Critically Endangered (CR) | Endangered (EN) | Vulnerable (VU) |
| A | Population size reduction (over 10 years or 3 generations) | ≥ 80–90% | ≥ 50–70% | ≥ 30–50% |
| B | Geographic range (Extent of Occurrence EOO, or Area of Occupancy AOO) | EOO <100 km² or AOO <10 km² AND severe fragmentation or ≤ 1 location or continuing declines | EOO <5,000 km² or AOO <500 km² AND severe fragmentation or ≤ 5 locations or continuing declines | EOO <20,000 km² or AOO <2,000 km² AND severe fragmentation or ≤ 10 locations or continuing declines |
| C | Small population size with continuing decline | <250 mature individuals | <2,500 mature individuals | <10,000 mature individuals |
| D1 | Very small population size | <50 mature individuals | <250 mature individuals | <1,000 mature individuals |
| D2 | Very restricted area of occupancy or number of locations (only for VU) | – | – | AOO <20 km² or ≤5 locations |
| E | Quantitative analysis (probability of extinction in the wild) | ≥50% within 10 years or 3 generations | ≥20% within 20 years or 5 generations | ≥10% within 100 years |
The Regional Red Listing Approach
The 2025 Regional Red Data Book utilised the IUCN’s Guidelines for Application of IUCN Red List Criteria at Regional and National Levels (Version 4.0; IUCN 2012). These guidelines ensure that regional assessments provide a balanced view, addressing both globally relevant conservation issues and specific regional priorities for research, monitoring, and action (IUCN 2012). The regional approach is crucial because, while the IUCN Red List Categories and Criteria primarily assess extinction risk at a global scale, practical conservation decisions and actions typically occur at national or regional levels.
Regional assessments apply the global IUCN Red List Categories and Criteria (Version 16, IUCN 2024) using only data from within the specified region. This preliminary regional category is then modified by considering populations outside the region, recognising their potential impact on local extinction risk (IUCN 2012).
In the regional Red Listing process, two additional categories are available to supplement the standard global categories:
- Regionally Extinct (RE): Used when a species no longer exists within the region but persists elsewhere. This recognises local extinction, highlighting regional conservation failures or issues needing immediate attention.
- Not Applicable (NA): Used for species that are either non-native, irregular visitors (vagrants), or do not fulfil the regional assessment criteria (e.g., very low regional occurrence <5% of the global population).
A key concept in the Regional Category adjustment is the ‘Rescue Effect,’ whereby immigration from neighbouring or extra-regional populations can potentially prevent local extinction. This mechanism is especially important for species whose regional populations might otherwise be considered at greater risk due to isolation or localised threats. In other words, non-endemic species have only some fractions of their global population assessed, resulting in a greater probability of classification being threatened by population-based criteria (B, C and D), and this needs to be accounted for.
The application of the ‘Rescue Effect’ involves carefully evaluating immigration potential and external population viability. If significant immigration is likely and extra-regional populations are stable or increasing, a species initially classified as threatened could be downlisted (e.g., from Endangered to Vulnerable) to better reflect the realistic risk of extinction within the region. Conversely, species reliant on declining external populations (demographic sinks) might need to be uplisted to accurately reflect increased regional extinction risk. An example of this would be vulture species drawn to poaching hotspots, which is arguably the case for the northern Kruger, which has seen catastrophic declines in vulture populations.
All modifications to the initial assessments, including category adjustments due to the Rescue Effect or other extra-regional considerations, follow a structured decision-making process as detailed in Figure 1 (from Appendix 3 in the IUCN Region Red list guidelines).
Figure 1. Decision-making process for adjusting preliminary IUCN Red List categories based on extra-regional populations (adapted from IUCN 2012). This diagram illustrates how the ‘Rescue Effect’ influences final regional assessments by guiding assessors in determining whether the initial regional extinction risk category should be adjusted (uplisted or downlisted). Species categories adjusted downward due to potential immigration and rescue by populations outside the region are marked with a degree symbol (e.g., VU°) to highlight this consideration.
The Geographical Region
The geographical scope of this assessment includes South Africa, Lesotho, and Eswatini, collectively referred to as ‘the region’ (Figure 2). This area has been consistently used across previous assessments (Siegfried et al. 1976, Brooke 1984, Barnes 2000, Taylor et al. 2015), allowing meaningful comparisons over time. The region is notable for its unique avifauna, robust conservation frameworks, engaged conservation community, and a well-developed network of academic and research institutions, enabling thorough scientific research and conservation initiatives.
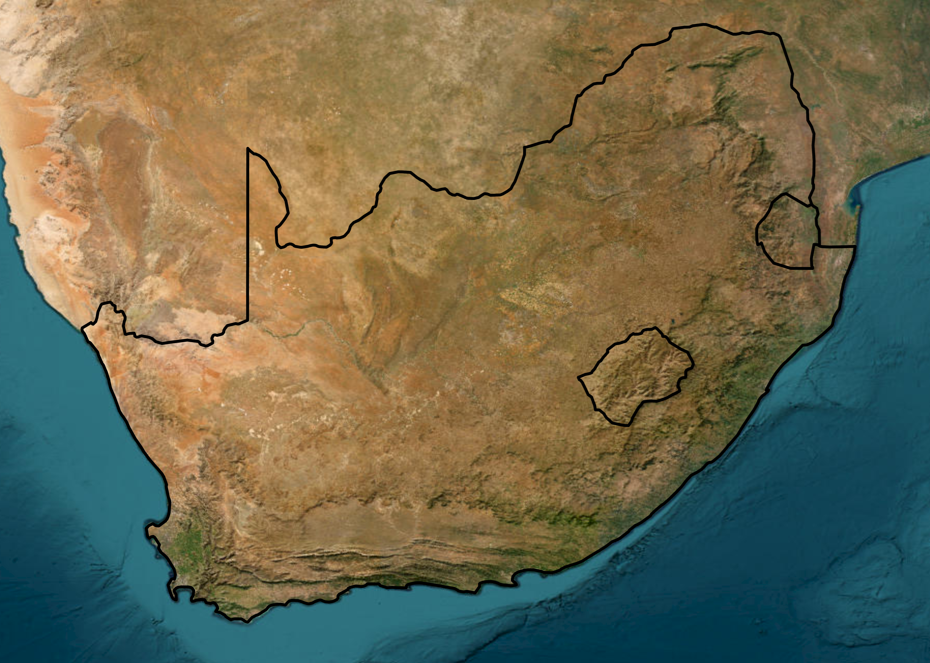
Figure 2: The terrestrial geographic domain for the Red Data Book 2025, including South Africa, Eswatini and Lesotho. The Prince Edward Islands are not indicated on this map.
South Africa’s territorial boundaries extend to the Subantarctic Prince Edward Islands. These islands consist of two distinct islands: Marion Island and Prince Edward Island. To avoid confusion, careful attention has been paid to pluralisation within this document. The term ‘Islands’ refers collectively to both Marion and Prince Edward Islands, whereas ‘Island’ singularly denotes one specific island within the pair.
This geographic delineation serves historical continuity and also strategically leverages existing conservation infrastructure and research capabilities, facilitating focused conservation efforts and allowing effective comparison of species’ status and trends over successive assessment periods (see Red List Index).
Taxonomic Conventions
For these assessments, we have followed the naming conventions and taxonomic framework of BirdLife South Africa, which primarily adheres to the naming standards of the International Ornithological Congress (IOC v14.2, Gill et al. 2024). However, select exceptions were applied, particularly concerning recently proposed taxonomic changes (IOC v15.1, Gill et al. 2025). BirdLife International taxonomy, which informs global Red List status, was included, based on data available in 2022. Given efforts of the major taxonomies to work together to produce one universally agreed upon names list, there will continue to be changes to names for the foreseeable future. BirdLife South Africa’s checklist documents changes made to bird names.
Species Assessments
Each species account (detailed assessment) was compiled by one or more assessors selected for their expertise and familiarity with the relevant taxon. To maintain consistency and rigor across assessments, feedback was provided by the Editorial Team of the 2025 Red Data Book of Birds of South Africa, Lesotho, and Eswatini, who have either completed the online Regional IUCN Red List Assessment training module or have extensive experience in training conservationists in applying the IUCN Red List Standard at both global and regional levels. This was done to ensure classifications adhered to the standardised IUCN format, including a category justification and details on population size and trends. Assessments include brief sections on taxonomy (with reference to the assessment), distribution, identification and ecology: we suggest interested readers refer to other sources for details on these aspects for each species.
Species accounts were reviewed internally by at least one editor, followed by external reviews from other taxon experts to ensure accuracy, comprehensiveness, and objectivity.
Species accounts open with a concise tabular summary presenting key names and taxonomic information alongside both the current and previous regional and global conservation statuses. The narrative concludes with an overview of ongoing conservation measures, proposed future actions, and clearly defined research priorities. These research recommendations highlight critical knowledge gaps and pertinent questions, aiming to guide future studies and stimulate targeted conservation research.
Terrestrial species distribution maps were generated primarily using data from the mobile application BirdLasser (Nel and Lee 2020) and the Southern African Bird Atlas Project 2 (SABAP2, Brooks et al. 2022), with assessors provide bespoke maps where these were available from their research. Given that SABAP2 is a continually updating citizen science initiative, a data cutoff date was set as end 2023 for consistency across all assessments, as most terrestrial assessments were written and reviewed during 2024. The geographic scale of individual species maps varies according to their distributional range. Africa-wide maps were incorporated for species where broader continental context was relevant, based on predictive model output from ABAP, eBird and iNaturalist data, where these were determined to be reflective enough of their distribution.
For seabird distributions, we refer readers to the maps in Taylor et al. (2015), or BirdLife International’s Datazone.
Initial Species Pool and Screening Criteria
Determining which species to assess follows the IUCN guidelines (Figure 3). The assessment considers all bird species occurring within the political boundaries of South Africa, Lesotho, and Eswatini, the same geographic scope used in previous Red Data Book assessments. Species deemed vagrants (i.e. occurring unpredictably or in negligible numbers) or introduced (i.e. non-native and not self-sustaining within the region’s natural ecosystems) were excluded from assessment. To be eligible for a regional assessment resulting in a Red List category other than Least Concern, at least 5% of a species’ global population or distribution had to occur within the region. This threshold reflects IUCN guidance that species with only peripheral or incidental occurrence in a region are unlikely to warrant regional conservation priority as for those species the conservation actions should fall on other nations/regions (Avery et al. 1995, IUCN 2012).
As the starting point, we used BirdLife South Africa’s Checklist of South Africa’s Birds (2023 edition), which listed 876 species. Of these, 123 species were classified as vagrants and 10 as introduced, and thus excluded from the assessment process. This left a working list of 743 species considered eligible for Red List evaluation.
To ensure continuity and allow for temporal comparisons, we automatically included all species that were assessed in the 2015 Red Data Book. Further analysis of citizen science data was conducted on the terrestrial species. Specifically, we examined trends from SABAP2 to identify a set of species with significant declines, from which a candidate list of species were flagged for full assessment. We also considered species where declines had been documented in published literature, specifically a further set of shorebirds.
Species meeting any of the above criteria were then assessed using IUCN regional categories and criteria. For seabirds that breed outside the region but are regularly recorded within South African waters, the global Red List status was generally adopted unless regional data indicated a need for reassessment.
For completeness, species that were eventually listed as Least Concern or NA are included in the materials we present here.
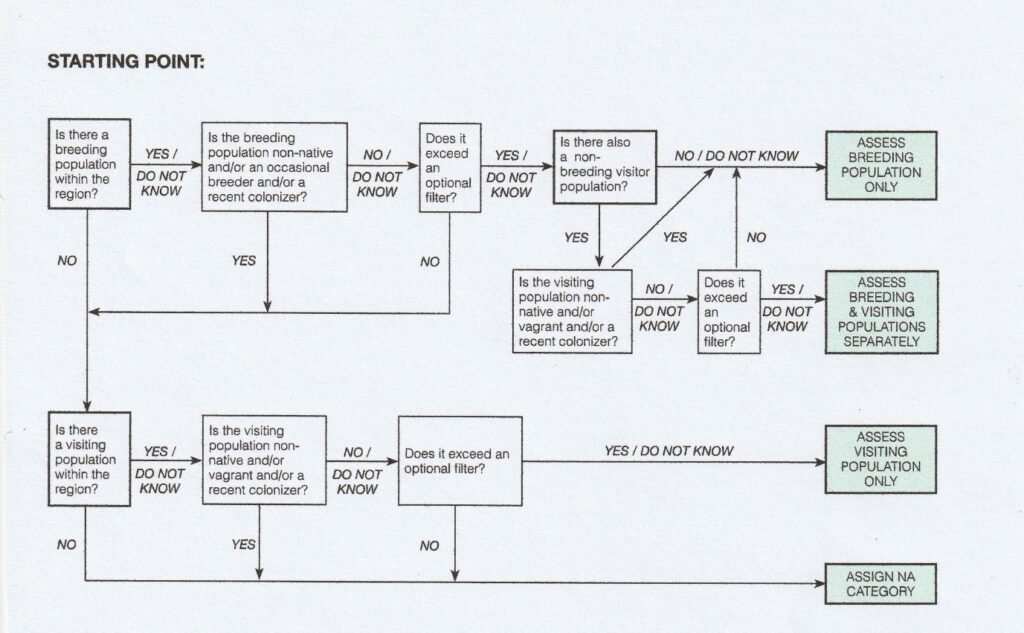
Figure 3: Flowchart to determine which taxa to include in a regional Red List. Step one of the regional Red List assessment process involves determining which taxa to assess, and which taxa to assign a Not Applicable (NA) category. The chart should be followed by answering each question, beginning in the top left corner. Figure from Annex 3 of the Guidelines for Application of IUCN Red List Criteria at Regional and National Levels: Version 4.0 (IUCN 2012).
Data Analysis Workflow and Assessment Process
The 2025 regional Red List assessments were informed by an expanded, methodologically rigorous analysis pipeline that integrated diverse data sources and analytical approaches. This phase represented a significant advance over previous efforts, both in terms of the breadth of datasets analysed and the depth of statistical methods applied.
Focus Areas in 2023
In 2023, priority was given to seabird assessments due to their high conservation concern and lack of publicly accessible datasets i.e. these assessments could only be informed by dedicated marine environment professionals, being the small pool of biologists which have conducted work around Marion Island. These assessments relied heavily on expert elicitation, unpublished monitoring reports, and targeted consultations. Concurrently, a comprehensive synthesis of citizen science datasets was undertaken for terrestrial species.
Citizen Science Analyses
A suite of analytical methods was applied to the Southern African Bird Atlas Project (SABAP2) dataset. These included:
- Logistic regression models estimating probability of reporting over time;
- ‘Reporting rate change’ comparisons between SABAP1 (1987-1992) and early SABAP2 (2007-2015) periods, using both classic reporting rate and measures derived from these (Underhill Z and C scores). This was repeated for within the SABAP2 period;
- Random forest models were used to visualise spatial range changes within the SABAP2 period, separated into early (2007-2015) and late (2016-2023) phases, and to predict reporting rate across the region.
To complement SABAP data, BirdLasser observations were modelled (using random forest models) at the 2×2 km grid level. Using BirdLasser presence data and absence data inferred from iNaturalist and eBird, spatial probability surfaces were generated. These were used to estimate Extent of Occurrence (EOO) and Area of Occupancy (AOO), based on a 0.5 reporting probability threshold. Where relevant, raw BirdLasser data were summarised using the ConR R package (Dauby et al. 2017), designed to inform IUCN Red Listing results for Criteria B. SABAP2 was also used to quantify species presence in protected areas, defined as pentads with ≥10% overlap with formally designated conservation areas, as well as other recognised biodiversity stewardship sites (e.g. botanical gardens).
CWAC and CAR Projects
The Coordinated Avifaunal Road Counts (CAR) dataset was analysed for the first time across 30 species it covered until 2022 (it now covers 51 species), including large-bodied terrestrial birds such as cranes, bustards and korhaans, selected raptors and storks. These analyses focused on trends in detection probability and bird counts over time.
Parallel efforts under the BIRDIE project (Cervantes et al. 2024), a collaboration between SANBI, SEEC, the FitzPatrick Institute, and BirdLife South Africa, refined dynamic occupancy models for waterbirds. The project built on the Coordinated Waterbird Counts (CWAC) database. The BIRDIE project produced annual probability-of-occurrence maps for 140 waterbird species, alongside detailed site-level trend analyses and an R package enabling access to the full CWAC dataset.
Workflow and Assessment Coordination
More than 200 synthesis documents summarising data from these analytical pipelines were distributed to species assessors. These were supplemented by the original 2015 assessment texts. However, assessors were required to use a new template to discourage superficial revisions and ensure rigorous re-evaluation. Assessments were subjected to peer review coordinated by a BirdLife South Africa-appointed editor. Final categories and criteria were captured centrally, along with retrospective adjustments to 2015 statuses when warranted.
In addition to the 132 species assessed in 2015, the following were added for full assessment:
- 43 waterbird species flagged by the CWAC/BIRDIE analyses as undergoing significant declines;
- 6 terrestrial species identified by SABAP2-based trend modelling as having marked declines in reporting probability;
- 7 globally uplisted species previously considered Least Concern;
- 21 species from the 2000 Red Data Book (Barnes 2000) that had been downlisted in 2015 or considered peripheral, re-evaluated in light of updated data;
- 4 species previously listed as Regionally Extinct (Egyptian Vulture, African Skimmer, Long-toed Lapwing, Blue Quail), re-examined for possible status change.
All assessment outcomes were recorded in a centralised database tracking both the 2015 and 2025 Red List categories for each species, including documented justifications for any category changes (e.g., genuine population change, improved data quality, or revised taxonomy). This then allowed us to quantify change using the Red List Index.
The Red List Index
The Red List Index (RLI), developed by the IUCN, provides a quantitative measure of extinction risk across sets of species, enabling the tracking of biodiversity trends over time. It complements individual species assessments by aggregating Red List category data into a single index value, thus offering a clear, policy-relevant metric of overall conservation status.
A declining RLI signals that species in the assessed group are, on average, sliding closer to extinction. Conversely, an increasing RLI suggests that overall extinction risk is decreasing, often reflecting the positive impact of conservation action. The index can be calculated at global, regional, or national levels and disaggregated by habitat, taxonomic group, or threat driver, making it adaptable for various conservation planning contexts.
In the context of this Red Data Book, the RLI was calculated for all species assessed in both the 2015 and 2025 regional assessments, allowing for direct comparison of extinction risk over the decade. This approach reveals not only how many species have changed category, but also whether the overall trajectory for the region’s avifauna is improving or worsening. As such, the RLI functions as both a summary statistic and a call to action, highlighting where biodiversity loss is accelerating and where further investment in conservation is most needed.
All species were filtered for consistent, non-missing data across both 2015 and 2025. Each Red List Category (e.g., Near Threatened, Vulnerable, Endangered) was converted into a numeric risk score from 0 for Least Concern to 5 for Regionally Extinct, which allowed calculation of the RLI for both years. This permitted direct comparison and a statistical evaluation (Wilcoxon signed-rank test) of category shifts. Species that lacked consistent category information or were designated vagrants or introduced in both years were excluded from the calculations.
The RLI was calculated using method developed by Butchart et al. (2007, 2025) in which the number of species in each category is multiplied by the category weight, and summed across all categories. This total is divided by the product of the total number of species and the maximum weight, and subtracted from 1. Mathematically this can be expressed through the equation below, where RLIt = the index value at time t; Wc(t,s) = the weight for Red List category c, which is summed for all species s at time t; WEX = the weight for the Regionally Extinct category (5); and N is the total number of assessed species, excluding those considered Data Deficient (none for this Red List):
𝑅𝐿𝐼𝑡=1−∑𝑠𝑊𝑐(𝑡,𝑠)𝑊𝐸𝑋⋅𝑁RLIt=1−∑sWct,sWEX⋅N
This assessment used standard IUCN Red List Categories (Least Concern [LC], Near Threatened [NT], Vulnerable [VU], Endangered [EN], Critically Endangered [CR], Regionally Extinct [RE], Extinct in the Wild [EW], Extinct [EX]). No species were recorded in the EW, or EX categories. Species recognised in the 2015 publication as threatened or near-threatened were re-examined to see if new evidence justified changes. Where up-to-date information revealed a true deterioration or improvement, species were assigned to a higher or lower threat category. In other instances, changes in a category resulted purely from methodological or knowledge-based improvements, rather than actual population changes. In these cases, ‘back-casting’ was performed to determine what the status in 2015 should have been given the new information available. RLI trend was calculated with these ‘back-cast’ categories.
RESULTS
This section reproduces results from the report by Lee and Rose (2025) on the RLI for SANBI, but updated where relevant.
Categories 2025 vs 2015
More species were classified as threatened in 2025 (147) than in 2015 (original assessment categories, 132 species) or 2000 (125 species). There were pronounced increases in the total numbers of bird species classified as NT and VU for 2025 (Figure 4).
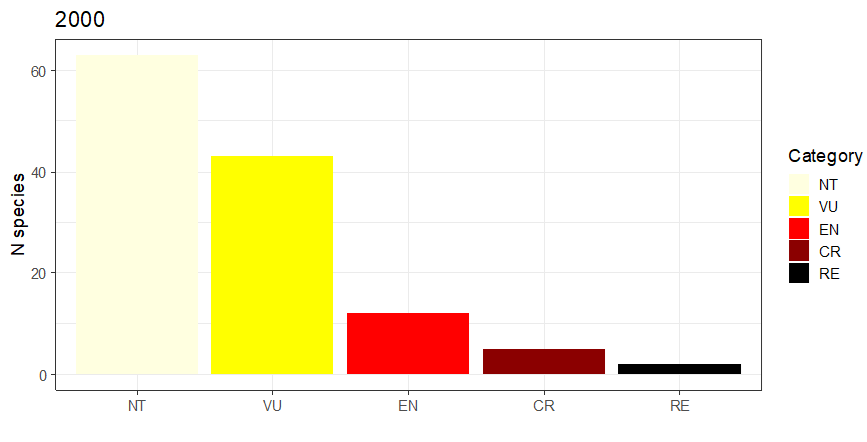
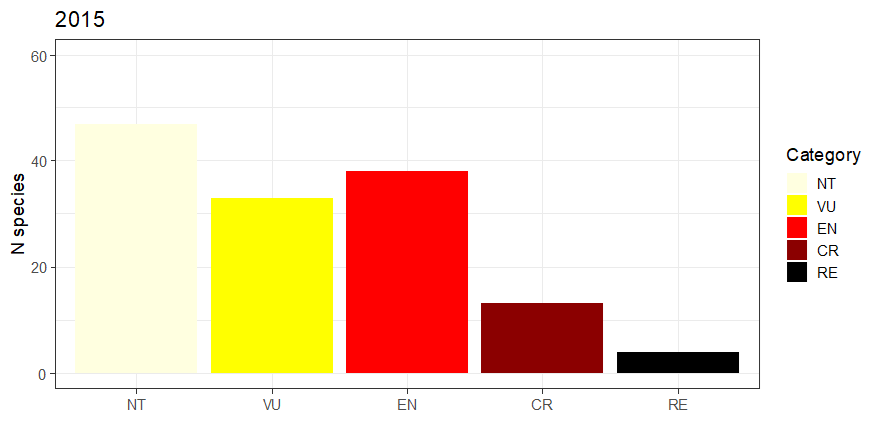
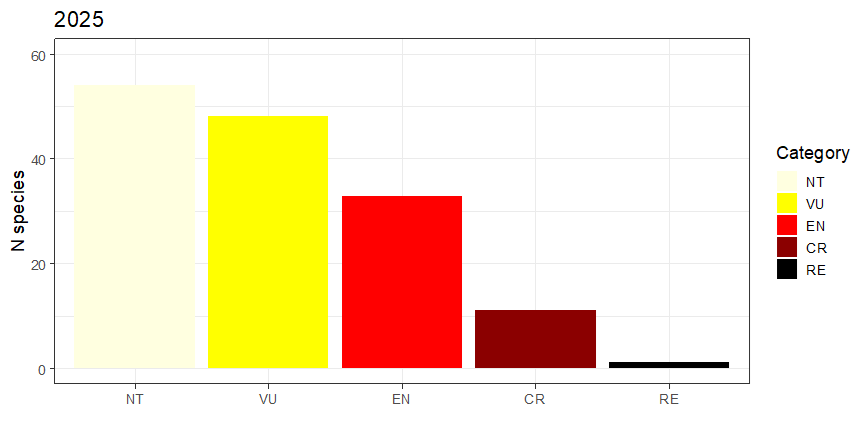
Figure 4: IUCN threat categories as presented for each historical regional assessment, excluding LC and NA.
The difference between categories was more pronounced in the table of back-cast (corrected) 2015 categories (Table 2).
Table 2: The number of species in each Red List category for 2025 and 2015 (back-cast), which informed the Red List Index equation. This table excludes 2 IUCN categories: Extinct in the Wild and Extinct, which does not apply to any species in the region. It is also important to note that categories may represent different species. Also: although some NA species identified during 2025 were excluded, the list of LC may contain additional peripheral species for which a comprehensive range or population analysis has not been conducted.
| ALL | RE | CR | EN | VU | NT | LC |
| 2015 | 1 | 11 | 34 | 37 | 43 | 616 |
| 2025 | 1 | 11 | 33 | 48 | 54 | 592 |
| Raptors | ||||||
| 2015 | 1 | 6 | 7 | 6 | 1 | 49 |
| 2025 | 1 | 7 | 6 | 6 | 2 | 48 |
| Waterbirds | ||||||
| 2015 | 0 | 0 | 1 | 4 | 7 | 108 |
| 2025 | 0 | 0 | 1 | 8 | 18 | 90 |
| Seabirds | ||||||
| 2015 | 0 | 3 | 13 | 8 | 17 | 16 |
| 2025 | 0 | 2 | 14 | 12 | 14 | 15 |
| Terrestrial | ||||||
| 2015 | 0 | 2 | 11 | 18 | 21 | 442 |
| 2025 | 0 | 2 | 12 | 22 | 20 | 438 |
Preliminary analyses of the set of threatened or newly identified candidate species indicated multiple reasons for category changes. Although 131 of the recorded changes were classified as “No Change,” 51 involved a genuine shift in status, pointing to real population declines or improvements. Other entries were explained by “Application of criteria” (usually for application of ‘Not Applicable’ [NA] status), “Error correction” (4 species), or “Improved knowledge.” The last category consisted of 16 species, where further insights as to species status were often the consequence of new or improved analysis techniques applied to citizen science data.
There were 2 threatened species lost to taxonomical updates: Barlow’s Lark (now Dune Lark, LC) and White-capped Albatross (lumped with Shy Albatross, NT). No species were split during this assessment period.
The use of a filter in regional assessments is recommended, to avoid marginal range species having a threatened status. This has been set at 5% (Barnes 2000), where the region should represent 5% of the global population, usually measured by the percentage of historical range (or EOO) falling within the region. Implementation of this filter is difficult, compounded by gaps in knowledge and special cases. A precautionary approach to this filter was generally used, where species with 3 or 4% by some measures were rounded to 5%. However, several species were assigned ‘Not Applicable’ status as per the IUCN Regional Red List guidelines Appendix 3 flowchart. Species assigned this status where this differed from the 2015 assessment status are listed as Appendix Table A1. All species which had an IUCN category in 2015 are considered as ‘Species of Conservation Concern’ and should be given full conservation attention.
Red List Index Calculations
The RLI was computed for 739 species across both 2015 and 2025. The RLI was 0.912 for 2015 and 0.899 for 2025, indicating a slight decline in overall species status (Figure 5). Birds are still dominated by those considered ‘Least Concern’. Overall, on average, these species face greater extinction risk now than they did a decade ago. A paired Wilcoxon signed-rank test confirmed that the decline in the RLI was statistically significant (p < 0.001). The result implies that these changes are not random noise.
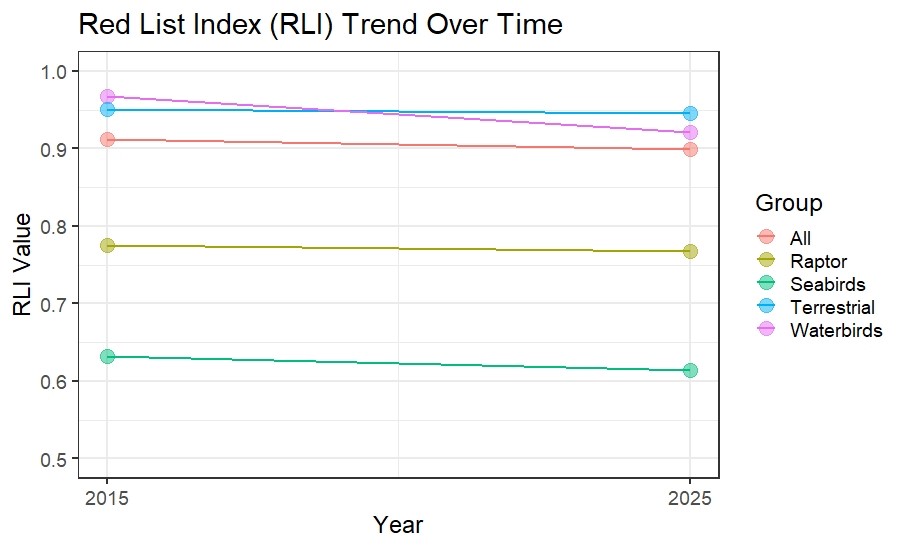
Figure 5: A line chart illustrating the Red List Index trend from 2015 to 2025, with the RLI on the vertical axis and years on the horizontal axis. ‘All’ is for 739 bird species. Note the steepest decline are in the waterbird group, although seabirds and raptors have the highest threat levels (lowest RLI values) overall (from Lee and Rose 2025).
Species Deteriorating or Improving
Among the 189 species formally assessed, 39 moved to higher threat categories (e.g., from LC or NT into VU or EN, Table 2), 8 improved (Table 3), and the remainder showed no category change. Of those that show no category change, many remain threatened (Figure 6). Deteriorating species included Grey Petrel and Maccoa Duck (Table 3), while improving species included Black-browed Albatross and Lanner Falcon (Table 3). In many cases, these shifts align with known threats like habitat loss or bycatch mitigation measures in fisheries.
A category-shift matrix (2015 to 2025) shows the transitions between previous and current categories (Figure 6). The greatest flux occurred between LC, NT, and VU, reflecting both moderate declines and small-scale improvements in certain species.
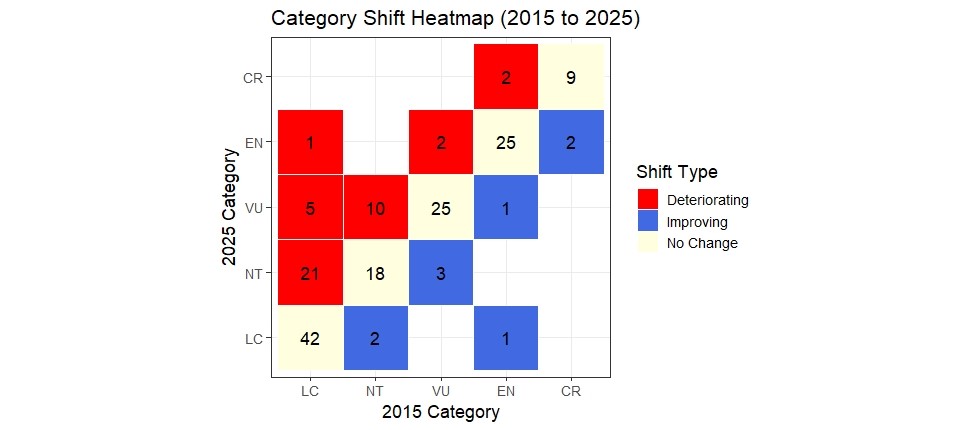
Figure 6: A heatmap showing how 170 species (the subset of assessed species with either no change or with a genuine change in status) in each 2015 category have moved to 2025 categories. Rows represent 2015 categories, columns represent 2025 categories, and colour intensity or cell labels indicate the number of species per transition.
As part of the Regional Red Listing process, consideration needs to be given to external populations to the region, and the role these may have in offsetting extinction risk, i.e. the ‘rescue effect’. There were 17 species where the regional extinction risk is considered to be buffered by the global population (Appendix Table 2).
A total of 25 species were uplisted from LC or Not Evaluated to higher threat categories due to deterioration in status. Most of these (n = 16) were waterbirds, followed by terrestrial (n = 6), seabirds (n = 2) and a raptor species (n = 1). The raptor was the Steppe Eagle, globally uplisted to Endangered in 2015, after publication of the 2015 regional Red Data Book. There is debate as to whether this migratory species should be assigned a regional category, as we are unsure whether or not 5% of the global population visits South Africa, and it has been assessed as a precautionary measure.
Table 3: Species elevated (uplisted) to a higher threat category (species with a genuine change in status only). NE = Not Evaluated. Species sorted by Bird Group and then status in 2025.
| Bird Group | Name | 2015 | 2025 |
| Raptor | Lappet-faced Vulture | EN | CR |
| Raptor | Steppe Eagle | LC | EN |
| Raptor | Red-footed Falcon | NT | VU |
| Raptor | Lesser Kestrel | LC | VU |
| Raptor | Marsh Owl | LC | NT |
| Seabird | Grey Petrel | VU | EN |
| Seabird | Light-mantled Albatross | NT | VU |
| Seabird | Lesser Sheathbill | NT | VU |
| Seabird | Hartlaub’s Gull | LC | VU |
| Seabird | Crowned Cormorant | NT | VU |
| Seabird | Flesh-footed Shearwater | LC | NT |
| Terrestrial | Botha’s Lark | EN | CR |
| Terrestrial | Black Stork | VU | EN |
| Terrestrial | Blue Crane | NT | VU |
| Terrestrial | Lesser Flamingo | NT | VU |
| Terrestrial | Blue Korhaan | LC | VU |
| Terrestrial | Chestnut-banded Plover | NT | VU |
| Terrestrial | Orange Ground Thrush | NT | VU |
| Terrestrial | Black-winged Kite | NE | NT |
| Terrestrial | Melodious Lark | LC | NT |
| Terrestrial | Ground Woodpecker | LC | NT |
| Waterbird | Maccoa Duck | NT | VU |
| Waterbird | Great Crested Grebe | NE | VU |
| Waterbird | Half-collared Kingfisher | NT | VU |
| Waterbird | Curlew Sandpiper | NE | VU |
| Waterbird | African Darter | LC | NT |
| Waterbird | Black-crowned Night Heron | LC | NT |
| Waterbird | Hamerkop | LC | NT |
| Waterbird | Great Egret | NE | NT |
| Waterbird | Knob-billed Duck | LC | NT |
| Waterbird | Red-billed Teal | NE | NT |
| Waterbird | White-backed Duck | LC | NT |
| Waterbird | Yellow-billed Duck | LC | NT |
| Waterbird | Cape Shoveler | LC | NT |
| Waterbird | Ruddy Turnstone | LC | NT |
| Waterbird | Sanderling | NE | NT |
| Waterbird | Red Knot | NE | NT |
| Waterbird | Grey Plover | LC | NT |
| Waterbird | Kittlitz’s Plover | LC | NT |
Table 4: Improving status: species downlisted to a lower threat category (species with a genuine change in status only).
| Bird Group | Name | 2015 | 2025 |
| Raptor | Lanner Falcon | VU | NT |
| Raptor | Cape Vulture | EN | VU |
| Seabird | Crozet Shag | CR | EN |
| Seabird | Spectacled Petrel | VU | NT |
| Seabird | Black-browed Albatross | EN | LC |
| Terrestrial | Wattled Crane | CR | EN |
| Terrestrial | Southern Bald Ibis | VU | NT |
| Terrestrial | Abdim’s Stork | NT | LC |
DISCUSSION
Overall, these 2025 results highlight a continued drift toward higher threat categories for many birds in of South Africa, Lesotho, and Eswatini. Many of the trends reported in the 2015 Red Data Book, such as habitat degradation, climate-driven range shifts, and hunting or poisoning, still play leading roles.
The deterioration in status of waterbirds that were previously not considered threatened is concerning but not unsurprising given the poor health of freshwater habitats in the region. Freshwater habitats are highly vulnerable to pollution, invasive species, siltation, and extreme weather events such as floods (e.g. van Deventer et al. 2019). The most recent National Biodiversity Assessment in the region concluded that estuaries and wetlands were the most threatened and least protected ecosystem (van Deventer et al. 2019). Addressing and improving freshwater health will take considerable political will and resources.
Besides habitat loss, many of these freshwater species are congregatory in nature which makes them vulnerable to disease outbreak. This group merits increased protection at key protected areas to prevent accelerated rates of declines. Urban freshwater habitats present unique opportunities for citizen-led habitat restoration and monitoring.
Botha’s Lark and Lappet-faced Vulture merit special mention as the two species that were uplisted to CR. For both of these species the key threats are well understood, being habitat loss and poisoning respectively. Urgent implementation of conservation action is required to prevent these species from going extinct.
Of those species that did not change categories many are threatened and show no improvement. Existing conservation implementation needs to be critically re-examined to develop effective future conservation action.
The four species (Egyptian Vulture, African Skimmer, Long-toed Lapwing, Blue Quail) listed as regionally extinct in 2015 were re-examined. Careful consideration of known data and in consultation with species experts it was concluded that, with the exception of Egyptian Vulture, these species were likely always marginal to the region. Consequently, African Skimmer, Long-toed Lapwing and Blue Quail are listed as peripheral (NA) in the 2025 Red Data Book.
Despite these concerning trends, some species showed improvement. The key message from this is the value of targeted conservation interventions, such as well-enforced marine protected areas reducing seabird bycatch or stewardship programs maintaining key grassland habitats. By strengthening such measures and improving land-use planning, there is potential to reverse the decline for others as well. This is probably especially pertinent to those species uplisted to NT, effective timely interventions may prevent further uplisting in future Red Lists.
The regional downlisting of species, such as the White-winged Flufftail (Sarothrura ayresi) from Critically Endangered to Endangered according to the IUCN Red List criteria, requires careful interpretation and contextualisation. The downlisting results from improved research techniques to detect this secretive species inhabiting the vegetated understorey of high-elevation wetlands, particularly through acoustic monitoring following the description of the bird’s call (Colyn et al. 2020a). Results from five years of dedicated surveys along the Eastern Escarpment of South Africa have revealed a slightly larger estimated population and breeding range than previously documented. Thus, the downlisting represents a technical adjustment based on improved data collection and scientific understanding rather than an actual improvement in the species’ conservation status. We firmly maintain that the White-winged Flufftail and its specialised wetland habitat continue to face severe threats requiring the highest level of protection and conservation action. Guidelines have recently been published to assist land users and other management authorities in maintaining and improving wetland health for the White-winged Flufftail and other waterbirds (Lloyd et al. 2025a). Guidelines will soon be published on surveying and mitigating impacts to the White-winged Flufftail to assist avifaunal specialists in advising development applications (Lloyd et al. 2025b). With Ethiopia, the only other country to host a breeding population, having sufficient habitat to support just 55 breeding pairs (Colyn et al. 2020b), South Africa will play an essential role in preventing the extinction of the White-winged Flufftail. We implore all stakeholders to maintain and intensify their commitment to protecting this highly threatened bird and the wetland ecosystems on which it and society depend, and make sure to understand whether or not a category change from 2015 represents a true change or simply improved information (stated in each assessment).
Limitations
Not all species were equally resurveyed or studied in detail over the past decade, which may have resulted in uneven data quality and uncertainty. Many of the trend results relied exclusively on citizen science data rather than species-specific monitoring. While citizen science projects generate invaluable data over long periods of time across the region there are limitations which impact results. SABAP2 coverage is generally biased towards urban and protected areas with regions such as the Northern Cape, Lesotho, rural Eastern Cape and North West poorly represented in the atlas data (Hugo and Altwegg 2017, Brooks et al. 2022). This discrepancy in coverage meant that for some species (e.g. Tawny Eagle) interpreting trend results was challenging.
CWAC sites are counted twice a year and while participants are encouraged to conduct counts more frequently this rarely occurs. For a bird group that is highly responsive to changing conditions it is difficult to disentangle changes in distribution, natural fluctuation in presence and genuine population trends. Volunteer fatigue and motivation across all projects is a major concern. CWAC and CAR are only useful if conducted over many years.
Methods were employed to try and address many of these limitations. Where uncertainty existed for populations or their trends, it was stated in assessments.
Although many changes were flagged as genuine shifts, a number of them may be driven by improved field knowledge rather than actual population changes. Additionally, precise attributions of threats can be challenging, as multiple drivers (e.g. urban expansion, agriculture, climate change) often overlap.
Conclusions and next steps
Although the RLI shows that overall extinction risk for many regional bird species has increased since 2015, some encouraging improvements demonstrate how dedicated conservation efforts can make a difference. Species such as Wattled Crane (CR → EN), Cape Vulture (EN → VU) and Southern Bald Ibis (VU → NT) have all been downlisted due to intense conservation efforts including captive rearing, rehabilitation, and colony protection. While these species are still threatened, it is encouraging that there is evidence of population recovery and lower risk of extinction for these species.
An important development in species conservation assessment is the introduction of the IUCN Green Status of Species (GSS), which complements the Red List by evaluating recovery potential and the impact of conservation interventions. The Green Status explicitly accounts for a species’ dependence on continued conservation action, offering a nuanced understanding of recovery trajectories and the sustainability of positive conservation outcomes. This is particularly relevant for species in the region that have shown genuine improvements in status, such as Wattled Crane and Cape Vulture, where conservation efforts have played a central role in population recovery. However, these improvements may be conservation-dependent, and removing such interventions could result in rapid reversals. We recommend that future regional assessments incorporate Green Status evaluations for a subset of species, particularly those flagged as improving or conservation reliant, to inform strategic conservation planning and prioritisation.
The 2025 Regional Red List clearly illustrated the immense value of the national citizen science projects (CWAC, CAR and SABAP2). It is imperative that these continue in order to generate robust future assessments.
References
Avery M, Gibbons DW, Porter R, Tew T, Tucker G, Williams G. 1995. Re- vising the British Red Data List for birds: the biological basis of U.K. conservation priorities. Ibis 137: 232-239.
Barnes KN (ed). 2000. The Eskom red data book of birds of South Africa, Lesotho and Swaziland. Johannesburg: BirdLife South Africa.
Brooke RK. 1984. South African red data book – birds. South African National Scientific Programmes Report No. 97. Pretoria: Foundation for Research Development, Council for Scientific and Industrial Research (CSIR).
Brooks M, Rose S, Altwegg R, Lee ATK, Nel H, Ottosson U, Thomson RL. 2022. The African Bird Atlas Project: a description of the project and BirdMap data-collection protocol. Ostrich 93: 223–232. https://doi.org/10.2989/00306525.2022.2125097
Bubb P, Butchart S, Collen B, Dublin H, Kapos V, Pollock C, Stuart S, Vie J-C. 2009. IUCN Red List index, guidance for national and regional use. Verion 1.1. Gland, Switzerland: IUCN Secretariat.
Butchart SHM, Stattersfield AJ, Baillie J, Bennun LA, Stuart SN, Akçakaya HR, Hilton-Taylor C, Mace GM. 2005. Using Red List Indices to measure progress towards the 2010 target and beyond. Philosophical Transactions of the Royal Society B 360: 255–268. https://doi.org/10.1098/rstb.2004.1583
Butchart SHM, Akçakaya HR, Chanson J, Baillie JE, Collen B, Quader S, Turner WR, Amin R, Stuart SN, Hilton-Taylor C. 2007. Improvements to the Red List Index. PLOS ONE 2(1): e140. https://doi.org/10.1371/journal.pone.0000140
Butchart SHM, Akçakaya HR, Berryman AJ, Brooks TM, Burfield IJ, Chanson J, Dias MP, Donaldson JS, Hermes C, Hilton-Taylor C, Hoffmann M. 2025. Measuring trends in extinction risk: a review of two decades of development and application of the Red List Index. Philosophical Transactions of the Royal Society B 380(1917): 20230206. https://doi.org/10.1098/rstb.2023.0206
Cervantes F, Altwegg R, Strobbe F, Skowno A, Visser V, Brooks M, Stojanov Y, Harebottle DM, Job N. 2023. BIRDIE: A data pipeline to inform wetland and waterbird conservation at multiple scales. Frontiers in Ecology and Evolution 11: 1131120. https://doi.org/10.3389/fevo.2023.1131120
Colyn RB, Campbell A, Smit-Robinson HA. 2020a. The use of a camera trap and acoustic survey design to ascertain the vocalisation and breeding status of the highly elusive White-winged Flufftail Sarothrura ayresi. Avian Conservation & Ecology 15: 2
Colyn RB, Howes-Whitecross MA, Howes C, Smit-Robinson HA. 2020b. Restricted breeding habitat of the Critically Endangered White-winged Flufftail in Ethiopia and its conservation implications. Ostrich 91: 204–213
Dauby G, Stévart T, Droissart V, Cosiaux A, Deblauwe V, Simo-Droissart M, Sosef MSM, Lowry PP II, Schatz GE, Gereau RE, Couvreur TLP. 2017. ConR: An R package to assist large-scale multispecies preliminary conservation assessments using distribution data. Ecology and Evolution 7: 11292–11303. https://doi.org/10.1002/ece3.3704
Gill F, Donsker D, Rasmussen P (eds). 2024. IOC World Bird List (v14.1). Available at: http://www.worldbirdnames.org
Gill F, Donsker D, Rasmussen P (eds). 2025. IOC World Bird List (v15.1). Available: https://www.worldbirdnames.org/new/
Hugo S, Altwegg R. 2017. The second Southern African Bird Atlas Project: Causes and consequences of geographical sampling bias. Ecology and Evolution 7: 6839–6849. https://doi.org/10.1002/ece3.3228
IUCN. 2012. IUCN Red List Categories and Criteria: Version 3.1. 2nd edn. Gland, Switzerland and Cambridge, UK: IUCN. iii + 32 pp.
IUCN. 2012. Guidelines for application of IUCN Red List criteria at regional and national levels: Version 4.0. Gland, Switzerland and Cambridge, UK: IUCN. iii + 41 pp.
IUCN Standards and Petitions Committee. 2024. Guidelines for using the IUCN Red List Categories and Criteria: Version 16. Prepared by the Standards and Petitions Committee. Available at: https://www.iucnredlist.org/documents/RedListGuidelines.pdf
Knape J. 2016. Decomposing trends in Swedish bird populations using generalized additive mixed models. Journal of Applied Ecology 53: 1852–1861. https://doi.org/10.1111/1365-2664.12744
Lee ATK, Nel H. 2020. BirdLasser: The influence of a mobile app on a citizen science project. African Zoology 55(2): 155–160.
Lee ATK, Rose SJ. 2025. Red List Index of the Birds of South Africa, Lesotho and Eswatini 2025. BirdLife South Africa, Johannesburg, Unpublished report.
Lloyd KJ, Muller M, Linström A, Grundling P-L, Pretorius L, Grundling RE, Smit-Robinson HA. 2025a. Best Practice Guidelines for High-Elevation Wetland and Peatland Management in Southern Africa, Version 1. Johannesburg: BirdLife South Africa. https://www.birdlife.org.za/wp-content/uploads/2025/05/Wetland-Management-Guidelines-layout-pages.pdf
Lloyd KJ, Ralston-Paton S, Day KD, Retief E, Smit-Robinson HA. 2025b. Guidelines for surveying and mitigating impacts on White-winged Flufftail in avifaunal assessments for development applications, Version 1. Johannesburg: BirdLife South Africa.
Siegfried WR, Frost PGH, Cooper J, Kemp AC. 1976. South African red data book – Aves. South African National Scientific Programmes Report No. 7. Pretoria: Council for Scientific and Industrial Research (CSIR).
Taylor MR, Peacock F, Wanless RM (eds). 2015. The Eskom red data book of birds of South Africa, Lesotho and Swaziland. Johannesburg: BirdLife South Africa.
Van Deventer H, Smith-Adao L, Collins N, Grenfell M, Grundling A, Grundling PL, Impson D, et al. 2019. South African National Biodiversity Assessment 2018: Technical Report. Volume 2: Inland Aquatic (Freshwater) Realm. Pretoria: South African National Biodiversity Institute.
Appendices
Table A1: Species listed as ‘Not Applicable’ (i.e. Peripheral) during 2025 and their Red List categories in 2015. These are all still ‘Species of Conservation Concern’.
| Name | 2015 Category |
| Gentoo Penguin | EN |
| Eurasian Curlew | NT |
| Pallid Harrier | NT |
| Lesser Jacana | VU |
| Pel’s Fishing Owl | EN |
| Allen’s Gallinule | LC |
| Eurasian Bittern | LC – Peripheral species |
| Corncrake | LC – Peripheral species |
| Yellow-billed Oxpecker | LC – Peripheral species |
| African Openbill | LC – Peripheral species |
| Ayre’s Hawk Eagle | LC – Peripheral species |
| Collared Pratincole | LC – Peripheral species |
| Black-throated Wattle-eye | LC – Peripheral species |
| African Skimmer | RE |
| Long-toed Lapwing | RE |
| Blue Quail | RE |
Table A2: Regionally threatened species where the ‘regional rescue’ effect was invoked to lower the probability of extinction, resulting in a downlisting of the conservation category.
| Name | Final category 2025 |
| Light-mantled Albatross | VU |
| Kerguelen Petrel | VU |
| Great White Pelican | VU |
| Yellow-throated Sandgrouse | NT |
| Lesser Kestrel | VU |
| African Crake | LC |
| Black Heron | LC |
| Black-crowned Night Heron | NT |
| Cape Shoveler | NT |
| Fulvous Whistling Duck | NT |
| Knob-billed Duck | NT |
| Red-knobbed Coot | LC |
| Southern Pochard | NT |
| White-backed Duck | NT |
| Sanderling | NT |
| Red Knot | NT |
| Great Egret | NT |
Table A3: Threatened species past and present: a list of all species considered in the 2015 and 2025 Regional Red Listing assessments. Species are sorted by 2025 Category according to highest threat category.
| SA_name | Scientific_name | 2015 original | 2025 | Criteria |
| Egyptian Vulture | Neophron percnopterus | RE | RE | |
| Leach’s Storm Petrel | Hydrobates leucorhous | CR | CR | C1+2a(i,ii); D |
| White-backed Vulture | Gyps africanus | CR | CR | A4bcd |
| Lappet-faced Vulture | Torgos tracheliotos | EN | CR | A2bde +A3de+A4bde; C1 |
| White-headed Vulture | Trigonoceps occipitalis | CR | CR | C1 |
| Hooded Vulture | Necrosyrtes monachus | CR | CR | Follows Global Status |
| Southern Banded Snake Eagle | Circaetus fasciolatus | CR | CR | D |
| Bearded Vulture | Gypaetus barbatus | CR | CR | A2acd+3bd+4abcd; C1+2a; E |
| Botha’s Lark | Spizocorys fringillaris | EN | CR | A2ab |
| Blue Swallow | Hirundo atrocaerulea | CR | CR | C1 |
| Taita Falcon | Falco fasciinucha | CR | CR | B1ab(i,ii,iii,v); C1; D |
| Tristan Albatross | Diomedea dabbenena | CR | CR | Follows Global Status |
| African Penguin | Spheniscus demersus | EN | EN | A2abce |
| Southern Rockhopper Penguin | Eudyptes chrysocome | EN | EN | A2a |
| Grey-headed Albatross | Thalassarche chrysostoma | EN | EN | A3e |
| Sooty Albatross | Phoebetria fusca | EN | EN | A3e |
| Grey Petrel | Procellaria cinerea | VU | EN | A3be; B2ab(v) |
| Cape Cormorant | Phalacrocorax capensis | EN | EN | A2bc |
| Bank Cormorant | Phalacrocorax neglectus | EN | EN | A2ae+3e+4ae; C1 |
| Saddle-billed Stork | Ephippiorhynchus senegalensis | EN | EN | D |
| Black Stork | Ciconia nigra | VU | EN | A2b |
| Bat Hawk | Macheiramphus alcinus | EN | EN | D |
| Tawny Eagle | Aquila rapax | EN | EN | A2bc+3bc; C1 |
| Steppe Eagle | Aquila nipalensis | NE | EN | Follows Global Status |
| Martial Eagle | Polemaetus bellicosus | EN | EN | A2acde+3cde+4acde |
| Bateleur | Terathopius ecaudatus | EN | EN | A2ab+C1 |
| Black Harrier | Circus maurus | EN | EN | C1 |
| White-winged Flufftail | Sarothrura ayresi | CR | EN | B2ab(iii) |
| Wattled Crane | Grus carunculata | CR | EN | D |
| Ludwig’s Bustard | Neotis ludwigii | EN | EN | A3b |
| Subantarctic (Brown) Skua | Stercorarius antarcticus | EN | EN | B2ab(v) |
| Damara Tern | Sternula balaenarum | CR | EN | C1 |
| Eastern Bronze-naped Pigeon | Columba delegorguei | EN | EN | B2b(ii); D |
| Mangrove Kingfisher | Halcyon senegaloides | EN | EN | D1; C2a(i,ii) |
| Southern Ground-Hornbill | Bucorvus leadbeateri | EN | EN | C1 |
| Green Barbet | Cryptolybia olivacea | EN | EN | B1ab(iii)+2ab(iii) |
| Rudd’s Lark | Heteromirafra ruddi | EN | EN | A2ac+A4ac; C1 |
| Spotted Ground Thrush | Geokichla guttata | EN | EN | B2b(ii,iii,v) |
| Rosy-throated Longclaw | Macronyx ameliae | NT | EN | B1ab(ii, iii)] |
| Kerguelen Tern | Sterna virgata | EN | EN | D |
| Indian Yellow-nosed Albatross | Thalassarche carteri | EN | EN | B2ab(v) |
| Crozet Shag | Leucocarbo melanogenis | CR | EN | A2abc; B2ab(iii, v) |
| Northern Royal Albatross | Diomedea sanfordi | EN | EN | Follows Global Status |
| Black-rumped Buttonquail | Turnix nanus | EN | EN | B2ab(ii,iii,iv); C2a(i) |
| Atlantic Yellow-nosed Albatross | Thalassarche chlororhynchos | EN | EN | Follows Global Status |
| Great Crested Grebe | Podiceps cristatus | NE | VU | A2c |
| Blue Petrel | Halobaena caerulea | NT | VU | A3e |
| Pink-backed Pelican | Pelecanus rufescens | VU | VU | A2c; D2 |
| Great White Pelican | Pelecanus onocrotalus | VU | VUo | A2ab+A4b; D2 |
| Cape Gannet | Morus capensis | VU | VU | D2 |
| Crowned Cormorant | Microcarbo coronatus | NT | VU | C1 |
| White-backed Night Heron | Calherodius leuconotus | VU | VU | D |
| Yellow-billed Stork | Mycteria ibis | EN | VU | D |
| Lesser Flamingo | Phoeniconaias minor | NT | VU | A2bcde; B2b(iii)+c(iv) |
| Maccoa Duck | Oxyura maccoa | NT | VU | A2ace; C1 |
| Secretarybird | Sagittarius serpentarius | VU | VU | C1 |
| Red-footed Falcon | Falco vespertinus | NT | VU | A2bc |
| Lesser Kestrel | Falco naumanni | LC | VUo | A2a |
| Verreaux’s Eagle | Aquila verreauxii | VU | VU | C1 |
| Crowned Eagle | Stephanoaetus coronatus | VU | VU | C1; D1 |
| African Marsh Harrier | Circus ranivorus | EN | VU | A2c+3c; C1 |
| Striped Flufftail | Sarothrura affinis | VU | VU | C1 |
| African Finfoot | Podica senegalensis | VU | VU | |
| Grey Crowned Crane | Balearica regulorum | EN | VU | C1 |
| Blue Crane | Grus paradisea | NT | VU | A3+A4abc |
| Denham’s Bustard | Neotis denhami | VU | VU | C1 |
| White-bellied Korhaan (Bustard) | Eupodotis senegalensis | VU | VU | C1 |
| Blue Korhaan | Eupodotis caerulescens | LC | VU | A2b; C1 |
| Chestnut-banded Plover | Anarhynchus pallidus | NT | VU | A2c, B2ab(iii, v), C1 |
| Curlew Sandpiper | Calidris ferruginea | NE | VU | A2bc+4bc |
| Burchell’s Courser | Cursorius rufus | VU | VU | A2c; C1+2a(i) |
| Hartlaub’s Gull | Chroicocephalus hartlaubii | LC | VU | A2a |
| Caspian Tern | Hydroprogne caspia | VU | VU | D1 |
| Roseate Tern | Sterna dougallii | EN | VU | D1 |
| African Grass Owl | Tyto capensis | VU | VU | A4c |
| Swamp Nightjar | Caprimulgus natalensis | VU | VU | D |
| Half-collared Kingfisher | Alcedo semitorquata | NT | VU | |
| African Broadbill | Smithornis capensis | VU | VU | A2c+3c+4c; C1 |
| Red Lark | Calendulauda burra | VU | VU | A3bc |
| Bush Blackcap | Sylvia nigricapillus | VU | VU | C2a(i) |
| Orange Ground Thrush | Geokichla gurneyi | NT | VU | B2b(ii,iii) |
| Short-tailed Pipit | Anthus brachyurus | VU | VU | B2b(ii, iii) |
| Yellow-breasted Pipit | Anthus chloris | VU | VU | A3c; C1+ 2a(i) |
| Neergaard’s Sunbird | Cinnyris neergaardi | NT | VU | B1ab(i,ii,iii); DÂ |
| Light-mantled Albatross | Phoebetria palpebrata | NT | VU° | [A2bde+A3e; B2ab(v)] |
| Kerguelen Petrel | Aphrodroma brevirostris | NT | VU° | B2ab(v) |
| Black-faced Sheathbill | Chionis minor | NT | VU | D2 |
| Macaroni Penguin | Eudyptes chrysolophus | VU | VU | A2bce |
| Cape Parrot | Poicephalus robustus | EN | VU | C2a(i) |
| Southern Black Korhaan | Afrotis afra | VU | VU | A4bc |
| White-chinned Petrel | Procellaria aequinoctialis | VU | VU | A4bcde; D2 |
| Wandering Albatross | Diomedea exulans | VU | VU | A3e; D2 |
| Southern Royal Albatross | Diomedea epomophora | VU | VU | Follows Global Status |
| Southern Giant Petrel | Macronectes giganteus | NT | NT | A3e |
| Great-winged Petrel | Pterodroma macroptera | NT | NT | A3e |
| Soft-plumaged Petrel | Pterodroma mollis | NT | NT | A3e |
| Sooty Shearwater | Ardenna grisea | NT | NT | A2de+3de+4de |
| Grey-backed Storm Petrel | Garrodia nereis | NT | NT | A3e; D2 |
| Black-bellied Storm Petrel | Fregetta tropica | NT | NT | D2 |
| African Darter | Anhinga rufa | LC | NT | A2c |
| Great Egret | Ardea alba | NE | NT° | A2a; C1 |
| Black-crowned Night Heron | Nycticorax nycticorax | LC | NT° | A2c |
| Hamerkop | Scopus umbretta | LC | NT | A2c; C1 |
| Marabou Stork | Leptoptilos crumenifer | NT | NT | D1 |
| Southern Bald Ibis | Geronticus calvus | VU | NT | A3c, C2a(ii) |
| Greater Flamingo | Phoenicopterus roseus | NT | NT | A2bc+3c+4c; B2b(iii) + c(iv) |
| Knob-billed Duck | Sarkidiornis melanotos | LC | NT° | C1 |
| African Pygmy Goose | Nettapus auritus | VU | NT | C1 |
| Cape Shoveler | Spatula smithii | LC | NT° | |
| Yellow-billed Duck | Anas undulata | LC | NT | A2bc |
| Red-billed Teal | Anas erythrorhyncha | NE | NT | A2c |
| Fulvous Whistling Duck | Dendrocygna bicolor | LC | NT° | A2c; C1 |
| Southern Pochard | Netta erythrophthalma | LC | NT° | A2bc |
| White-backed Duck | Thalassornis leuconotus | LC | NT° | C1 |
| Cape Vulture | Gyps coprotheres | EN | VU | A3cd |
| Lanner Falcon | Falco biarmicus | VU | NT | C1 |
| Black-winged Kite | Elanus caeruleus | NE | NT | A2bc |
| Baillon’s Crake | Zapornia pusilla | LC | NT | B2b(ii,iii) |
| Kori Bustard | Ardeotis kori | NT | NT | A2bcd+3bcd+4bcd, C1 |
| Karoo Korhaan | Heterotetrax vigorsii | NT | NT | A2b |
| Ruddy Turnstone | Arenaria interpres | LC | NT | A2c |
| Kittlitz’s Plover | Anarhynchus pecuarius | LC | NT | A2ac |
| Grey Plover | Pluvialis squatarola | LC | NT | A2b |
| Red Knot | Calidris canutus | NE | NT° | A2ac; C1 |
| Sanderling | Calidris alba | NE | NT° | A2a; C1 |
| Yellow-throated Sandgrouse | Pterocles gutturalis | NT | NT° | C2a(ii) |
| Marsh Owl | Asio capensis | LC | NT | A2bc+3bc+4bc |
| European Roller | Coracias garrulus | NT | NT | A2b+4c |
| Ground Woodpecker | Geocolaptes olivaceus | LC | NT | |
| Melodious Lark | Mirafra cheniana | LC | NT | A2b+3b+4b |
| Short-clawed Lark | Certhilauda chuana | NT | NT | A2c; C1 |
| Sclater’s Lark | Spizocorys sclateri | NT | NT | A2b + A3c |
| Cape Rockjumper | Chaetops frenatus | NT | NT | A2bc+3bc+4bc, E |
| Knysna Warbler | Bradypterus sylvaticus | VU | NT | C1; C2a(i) |
| Protea Canary | Crithagra leucoptera | NT | NT | A2ae + A3ae + A4bce |
| Salvin’s Prion | Pachyptila salvini | NT | NT | A3e |
| Fairy Prion | Pachyptila turtur | NT | NT | A3e |
| Flesh-footed Shearwater | Ardenna carneipes | NE | NT | Follows Global Status |
| Lemon-breasted Canary | Crithagra citrinipectus | NT | NT | B2 |
| Mountain Pipit | Anthus hoeschi | NT | NT | A3c; C1 |
| Northern Giant Petrel | Macronectes halli | NT | NT | A3e |
| South Georgia Diving Petrel | Pelecanoides georgicus | NT | NT | A3e; D2 |
| King Penguin | Aptenodytes patagonicus | NT | NT | D2 |
| Fynbos Buttonquail | Turnix hottentottus | EN | NT | B2ab(ii,iii); A2bc+A3c |
| Spectacled Petrel | Procellaria conspicillata | VU | NT | Follows Global Status |
| Agulhas Long-billed Lark | Certhilauda brevirostris | NT | NT | B1 |
| Shy Albatross | Thalassarche cauta | NT | NT | Follows Global Status |
| Little Grebe | Tachybaptus ruficollis | NE | LC | |
| Black-browed Albatross | Thalassarche melanophris | EN | LC | Follows Global Status |
| Common Diving Petrel | Pelecanoides urinatrix | NT | LC | |
| Grey Heron | Ardea cinerea | LC | LC | |
| Black-headed Heron | Ardea melanocephala | LC | LC | |
| Purple Heron | Ardea purpurea | LC | LC | |
| Yellow-billed Egret | Ardea brachyrhyncha | LC | LC | |
| Western Cattle Egret | Bubulcus ibis | LC | LC | |
| Green-backed (Striated) Heron | Butorides striata | LC | LC | |
| Black Heron | Egretta ardesiaca | LC | LC° | |
| Woolly-necked Stork | Ciconia episcopus | LC | LC | |
| Abdim’s Stork | Ciconia abdimii | NT | LC | |
| White Stork | Ciconia ciconia | NE | LC | |
| Spur-winged Goose | Plectropterus gambensis | LC | LC | |
| Egyptian Goose | Alopochen aegyptiaca | LC | LC | |
| South African Shelduck | Tadorna cana | LC | LC | |
| African Black Duck | Anas sparsa | LC | LC | |
| Blue-billed Teal | Spatula hottentota | LC | LC | |
| White-faced Whistling Duck | Dendrocygna viduata | LC | LC | |
| Peregrine Falcon | Falco peregrinus | LC | LC | |
| African Fish Eagle | Icthyophaga vocifer | LC | LC | |
| Forest Buzzard | Buteo trizonatus | LC | LC | |
| African Crake | Crecopsis egregia | LC | LC° | |
| Red-chested Flufftail | Sarothrura rufa | LC | LC | |
| African Swamphen | Porphyrio madagascariensis | LC | LC | |
| Red-knobbed Coot | Fulica cristata | LC | LC° | |
| Black-bellied Korhaan | Lissotis melanogaster | NE | LC | |
| African Jacana | Actophilornis africanus | LC | LC | |
| Greater Painted-snipe | Rostratula benghalensis | NT | LC | |
| African Black Oystercatcher | Haematopus moquini | LC | LC | |
| White-fronted Plover | Anarhynchus marginatus | LC | LC | |
| Three-banded Plover | Charadrius tricollaris | LC | LC | |
| Black-winged Lapwing | Vanellus melanopterus | NE | LC | |
| White-crowned Lapwing | Vanellus albiceps | NE | LC | |
| Black-winged Pratincole | Glareola nordmanni | NT | LC | |
| Common Tern | Sterna hirundo | NE | LC | |
| Antarctic Tern | Sterna vittata | EN | LC | Follows Global Status |
| White-winged Tern | Chlidonias leucopterus | NE | LC | |
| Black Coucal | Centropus grillii | LC | LC | |
| Knysna Woodpecker | Campethera notata | NT | LC | |
| Sentinel Rock-thrush | Monticola explorator | LC | LC | |
| Fan-tailed Grassbird | Catriscus brevirostris | LC | LC | |
| Rudd’s Apalis | Apalis ruddi | LC | LC | |
| Woodward’s Batis | Batis fratrum | LC | LC | |
| African Rock Pipit | Anthus crenatus | NT | LC | |
| Red-billed Oxpecker | Buphagus erythrorynchus | LC | LC | |
| Gurney’s Sugarbird | Promerops gurneyi | LC | LC | |
| Magpie Mannikin | Spermestes fringilloides | LC | LC | |
| Pink-throated Twinspot | Hypargos margaritatus | LC | LC | |
| Drakensberg Rockjumper | Chaetops aurantius | LC | LC | |
| Eurasian Bittern | Botaurus stellaris | LC – Peripheral species | NA | |
| African Openbill | Anastomus lamelligerus | LC – Peripheral species | NA | |
| Ayre’s Hawk Eagle | Hieraaetus ayresii | LC – Peripheral species | NA | |
| Pallid Harrier | Circus macrourus | NT | NA | |
| Blue Quail | Synoicus adansonii | RE | NA | |
| Corncrake | Crex crex | LC – Peripheral species | NA | |
| Allen’s Gallinule | Porphyrio alleni | LC | NA | |
| Lesser Jacana | Microparra capensis | VU | NA | |
| Long-toed Lapwing | Vanellus crassirostris | RE | NA | |
| Eurasian Curlew | Numenius arquata | NT | NA | |
| Collared Pratincole | Glareola pratincola | LC – Peripheral species | NA | |
| African Skimmer | Rynchops flavirostris | RE | NA | |
| Pel’s Fishing Owl | Scotopelia peli | EN | NA | |
| Black-throated Wattle-eye | Platysteira peltata | LC – Peripheral species | NA | |
| Yellow-billed Oxpecker | Buphagus africanus | LC – Peripheral species | NA | |
| Gentoo Penguin | Pygoscelis papua | EN | NA | A2abc |


Explore Bird Species by Conservation Status


Why It Matters

Biodiversity is the foundation of healthy ecosystems, and birds are key indicators of environmental change.
With escalating pressures from human activities and climate change, many bird species in South Africa, Lesotho, and Eswatini are now at risk of extinction. By understanding their status, we can take informed steps to safeguard these species and the ecosystems they inhabit.
The Red Data Book serves as a critical tool for conservation practitioners, researchers, and policymakers working towards the long-term survival of Southern Africa’s avifauna.

Donate to BirdLife South Africa
Our generous sponsors


