


Regional Endemics and Near Endemics listed as Least Concern
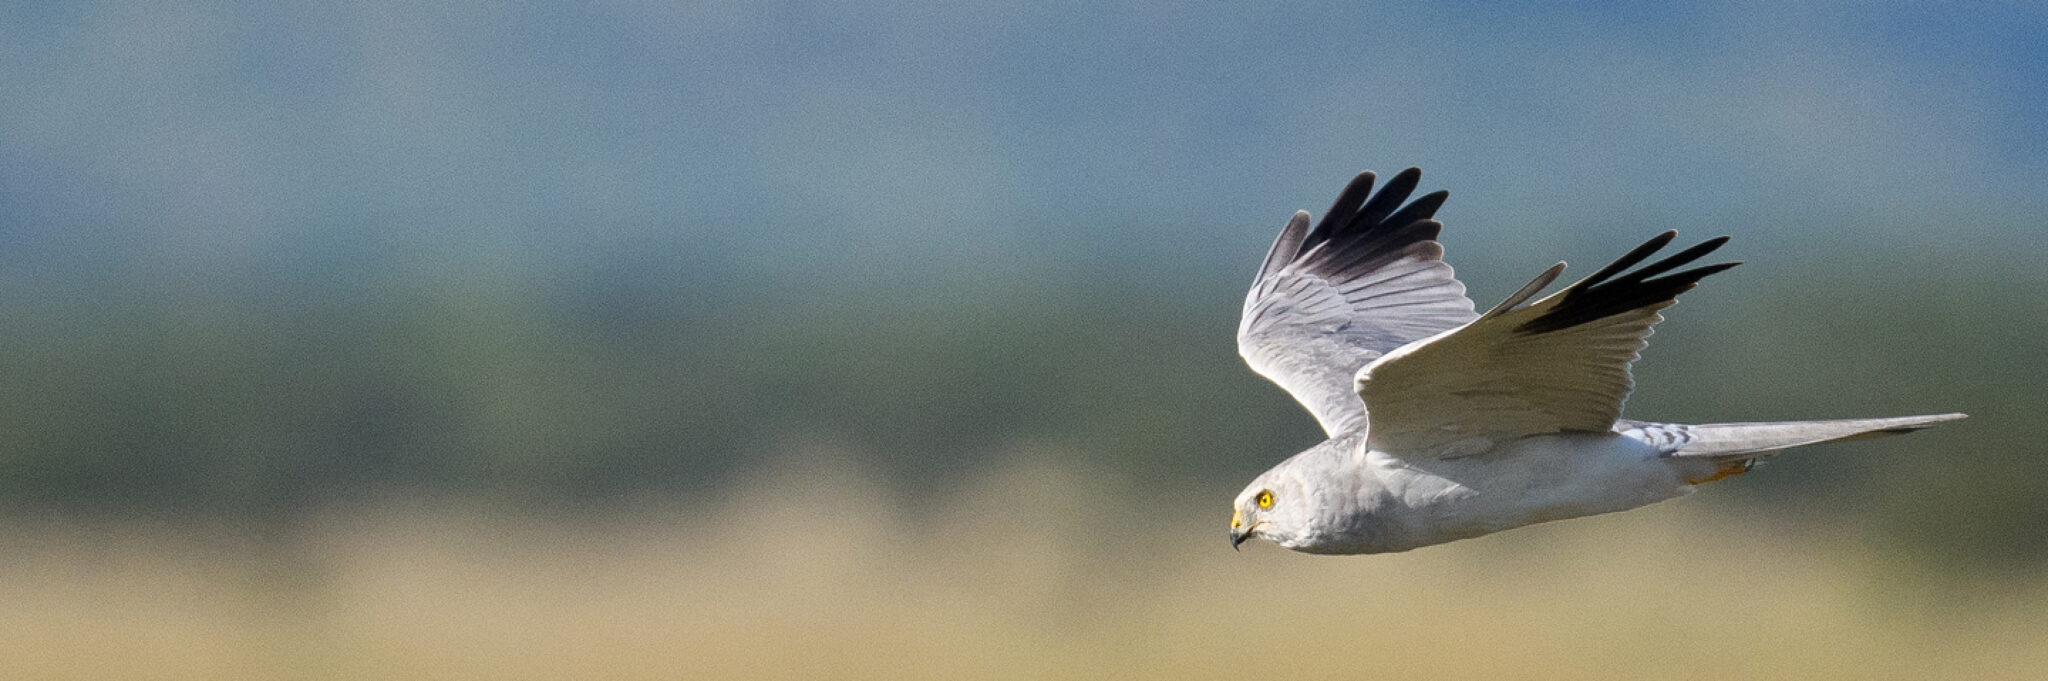
Image © Dylan Vasapolli, Birding Ecotours
Regional Red Data Book of the Birds of South Africa, Lesotho and Eswatini 2025:
Regional Endemics and Near Endemics listed as Least Concern
Author: Alan Lee
Regionally endemic species, i.e. those with at least 90% of their global range restricted to South Africa, Lesotho and Eswatini, are a special conservation responsibility to the region’s conservation authorities.
This section contains basic information for 71 species, either listed as endemic or near endemic according to the Checklist of Birds of South Africa 2025, or which were modelled to contain >70% of their Africa range (at the pentad level) in South Africa, Lesotho and Eswatini, and thus includes some species with traditionally wider distributions e.g. Red-throated Wryneck and White-necked Raven.
For each species account we present trends based on examining output from SABAP2 trends (logistic models indicating declines or increases) together with predicted range change metrics. If there was consensus in directions of trends (significant increase or decrease), then the trend was labelled as such, although magnitudes of change are not always indicated. For species with non-significant trends, or changes <5% over 3 generations, these are classified as ‘stable’. Where there was disagreement between models, the status is ‘Uncertain’, although intrinsic knowledge on the status of range and habitat was also used to influence trend categories.
Area of Occupancy and Extent of Occurrence measures result from modelled range predicted at the 2×2 km grid level using Random Forest machine learning methods with BirdLasser (validated using SABAP2 data) locations for presence and eBird and iNaturalist records to augment absence data, with the resulting Red List measures calculated using the ‘red’ package in R. Figures are in square kilometers. Note that suitable habitat will generally be a smaller area than values presented here.
Much of the general information presented for each species account is summarized from either Roberts 7 (Hockey et al. 2007), or Taylor et al. 2015. Additional information was sourced Handbook of the Birds of the World (online); or relevant recent publications where indicated. Distribution maps chosen to illustrate distribution across South Africa, Lesotho and Eswatini are the SABAP2 distribution maps, with percentage change difference in reporting rates between 2007-2015 and 2016-2023 periods as colour. Note, coverage gaps (Northern Cape and Eastern Cape) are not indicated on these. These maps were chosen as these are the ‘source’ data for much of our understanding of bird distributions, and modelled output across species was often inconsistent.
Our generous sponsors


