


Lesser Flamingo
Phoeniconaias minor

Number Of Mature
Individuals (Regional)
89 000 – 191 000

Regional
Population Trend
Decreasing
2025
Regional Category
Vulnerable
Search by species
CONTENTSOverview
Names
|
IOC English Name: |
Lesser Flamingo |
|
SA & IOC Scientific Name: |
Phoeniconaias minor |
|
BirdLife International Taxonomy (scientific name): |
Phoeniconaias minor |
|
Order: |
PHOENICOPTERIFORMES |
|
Family: |
Phoenicopteridae |
|
Species name author: |
Geoffroy Saint-Hilaire É 1798 |
|
Afrikaans: |
Kleinflamink |
|
Sesotho (South Africa): |
mmamolalana-lomotshwana |
|
Sesotho (Lesotho): |
mamolalana-lomotoana |
|
Siswati: |
|
|
Zulu: |
Ukholwasomncane |
Current Assessment Status
|
2025 Regional Category [Criteria] |
VU [A2bcde; B2b(iii)+c(iv)] |
|
2024 Global Category [Criteria] |
NT [A2c+3c+4c] (BirdLife International 2018) |
|
Population size (Regional) |
89 000 – 191 000 (Lee 2024) |
|
Population size (Global) |
2 220 000 – 3 240 000 (BirdLife International 2018) |
|
Distribution size (EOO) (Regional) km2 |
1 230 796 (Lee 2024) |
|
Distribution size (EOO) (Global) km2 |
27 700 000 (BirdLife International 2018) |
|
Distribution size (AOO) (Regional) km2 |
c. 1360 (Anderson, unpubl data 2024) |
|
Generation time |
15.5 years (BirdLife International 2018) |
|
Status change reason |
Genuine change in status |
|
Migrant (in the region) |
Partial migrant and nomad |
|
Regional endemic |
No |
Historic Listing Information
|
2000 Regional Status |
NT [A1c+2c] |
|
2015 Regional Status |
NT [A2c+3c+4c] |
|
Status change reason (if applicable) |
No change |
|
2015 Population size (Regional) |
c. 120 000 individuals (southern Africa) |
|
2015 Global Status |
NT [A2c+3c+4c] |
Reason for Inclusion
Reason for Inclusion in the Assessment
The Lesser Flamingo Phoeniconaias minor was assessed as regionally Near Threatened in 2015 (Anderson 2015a).
Category Justification
Category Justification
The regional population is assessed as Vulnerable under Criteria A2bcde; B2b(iii) + c(iv). New information and analyses of Coordinated Waterbird Counts (CWAC), and breeding count data indicate a suspected further decline and potential future decline in the population size (Appendix 1).
Criterion A Population decline:
The regional population appears to be undergoing a reduction of between 24–86% over three generations (Appendix 1) due to a suspected decline in habitat quality over the past decade (van Deventer et al. 2019); with a low confidence due to statistical assumptions, and because the abundance data for the regional population estimates are from CWAC and breeding counts; and these various methods reduce the accuracy. Also, the data covers only a third of the sites where the species occurs and therefore the calculations do not cover the entire regional population. Due to the above uncertainties, a decline range instead of a single value is assessed. Assuming the lowest rate of decline is a closer estimate, the 24% decline over three generations approaches but does not meet the > 30% threshold for Vulnerable under Criterion A. However, it is unknown whether the low recruitment rate of the Southern African population (Simmons 2015), which is suspected to be declining, can replenish the regional population. Climate change, predicted to cause rapid aridification across most of the regional range of this species (Engelbrecht et al. 2024), may increase the rate of decline to >30% over a few generations. Furthermore, breeding events have been irregular for more than 10 years; therefore, the population is considered a non-breeding population for this assessment. Based on the lack of consistent breeding, and a precautionary and low risk approach, the species is assessed as Vulnerable.
Criterion B Area of Occupancy (AOO):
Establishing a single-value AOO estimate is difficult as there are regular fluctuations in the AOO in response to site hydrological conditions and food abundance. There are also extreme seasonal and annual fluctuations in the number of individuals (Appendix 1).
Various AOO estimates exist for this species but vary greatly in their order of magnitude. The is little evidence to suggest that the 2015 estimate of AOO (1204 km2 (Anderson 2015a)) has changed significantly (Appendix 1). Using the 2×2 km grid cell approach dictated by the IUCN the updated AOO is <1360 km2 with an expected continuing decline in habitat quality and extreme fluctuations in the numbers of mature individuals (Appendix 1). This AOO value takes into account Kamfers Dam (the only breeding site in the region) and other critical wetlands used for nesting in the past, stopover sites and regularly occupied key feeding sites that support the largest subpopulations. These are assumed to form the smallest essential network of specialist sites to support the regional population (Figure 1).
Other estimates of AOO which are based on BirdLasser data are much greater (200 892 km2 (Lee 2024)) and BIRDIE (CWAC data, AOO of 185 688 km2 (2579 pentads in 2022)). Interpreting recent CWAC data is challenging as several key sites have not been counted since 2015.
This assessment takes the low risk and precautionary approach and uses the smallest AOO essential for the survival of the regional population which for this species includes the critical nesting areas (IUCN Standards and Petitions Committee 2024). Lesser Flamingos are mass colonial nesters with potentially irreplaceable nesting sites. The smallest AOO considered essential for the survival of the regional population (1360 km2) was therefore used for this assessment (Appendix 1). The AOO therefore meets the threshold for Vulnerable under Criterion B2.

Figure 1: Breeding, key feeding and stopover sites considered essential for the regional population (Anderson unpubl 2024, Appendix 1). The breeding site is also a stopover and feeding site (Pretorius et al. 2020).
Population Justification
The global population was estimated at 2 – 6 million individuals (Brown et al. 1982, Simmons 2000), with c. 4 million occurring in Africa in the mid-1990s (Simmons 1997). The latest global estimate is 2 220 000 – 3 240 000 (BirdLife International 2018). The population estimate for the Southern African population is 120 000 – 200 000 individuals (Dodman 2014, Nagy and Langendoen 2020).
Lesser Flamingos are highly mobile, population numbers fluctuate frequently and dense concentrations at sites make counts for population estimates very challenging (Colyn et al. 2024).
The current regional population estimate is 89 991 – 191 835 (Lee 2024) The sum of the mean of 4307 counts (at 170 CWAC sites) surveyed from 2008-2023 (one generation) was used for the minimum estimate. The sum of the maximum counts for this period is used for the maximum estimate, with medium confidence, as it may be an overestimate because of potential double-counting due to movements between sites (Lee 2024). The maximum number of individuals estimated in South Africa was 81 664 in 2006 (Groom et al. 2011) at the largest subpopulation which often supported >50% of the regional population; Kamfers Dam (Colyn et al. 2024).
Trend Justification
The global population is considered to be in decline (BirdLife International 2018) and the Southern African population is suspected to be declining due to fewer successful large breeding events and climate change impacts (aridification and extended droughts) at their two breeding sites (Simmons 2015, Engelbrecht et al. 2024). Projected change in climate (increased temperatures and decreased precipitation) is a concern, with more heat-wave days in the central regions of South Africa (Engelbrecht et al. 2024).
The regional population too is declining. The rate of the regional decline is estimated to range between 24% to 86% (over three generations), using the exponential decline model provided by the IUCN and assuming the decline is constant (Appendix 1, CWAC data). The CWAC data covers only 36% of the 474 sites where the species has been recorded according to BirdLasser data (Lee 2024). However, the CWAC sites include most of the sites known to support the largest subpopulations. The IUCN red listing guidelines recommend considering a range of decline rates for assessing the decline when populations fluctuate and estimates are uncertain (IUCN Standards and Petitions Committee 2024). The lower bound of 24% is also recommended due to uncertainties and regularly surveyed of only a portion of the population. The estimated decline, irregular and boom or bust breeding events, climate change and continued decline in regional wetland habitat quality outside of formally protected areas with little chance of improvement in quality in the foreseeable future, indicates a suspected future decline in the regional population.
Trend analysis based on South African Bird Atlas (SABAP) data revealed a small increase in reporting rate and range (3.2%) in the last eight years; with a good confidence level (Lee 2024). A comparison of SABAP data from 1987-1991 and 2007-2015 predicted a small decline in range (Lee 2024). The flooding of Kamfers Dam over the past four years forced the largest subpopulation of flamingos to disperse to other wetlands. Some range changes could also be the result of higher rainfall years from 2021 onwards which may have caused wider dispersal. A linear regression of the CWAC data (over the past 24 years) indicated a slight decrease in numbers (Lee 2024). These trends may indicate both natural fluctuations in regional population numbers over the shorter term and a decline in numbers over the longer term.
Biology & Ecology
Taxonomy
There are no notable issues (del Hoyo et al. 2020).
Identification
The smaller and darker pink of Africa’s two flamingos. Males larger. Plumage pink, but paler when not breeding. Juvenile birds smaller than adults, and brownish grey; immature birds smaller and whiter than non-breeding adults. Bill deep crimson to maroon, tipped black, and appears all-black at a distance. Bill of juveniles and immature dark grey, turning dark maroon when reaching adulthood (Simmons 2005, BirdLife International 2024a). It is difficult to distinguish between Lesser and Greater Flamingo Phoenicopterus roseus chicks without examining their bill structure.
Distribution
The global distribution of the Lesser Flamingo includes Africa and south Asia (mainly India, the Arabian Gulf Coast and Pakistan) which support four large populations (BirdLife International 2018). Two of the populations are found in sub-Saharan Africa, with the highest densities at the Great Rift Valley Lakes of East Africa and in Southern Africa (Brown et al. 1982, Delany and Scott 2006, BirdLife International 2018). The third is a small coastal population in West Africa (Moreno-Opo et al. 2013, Figure 2).
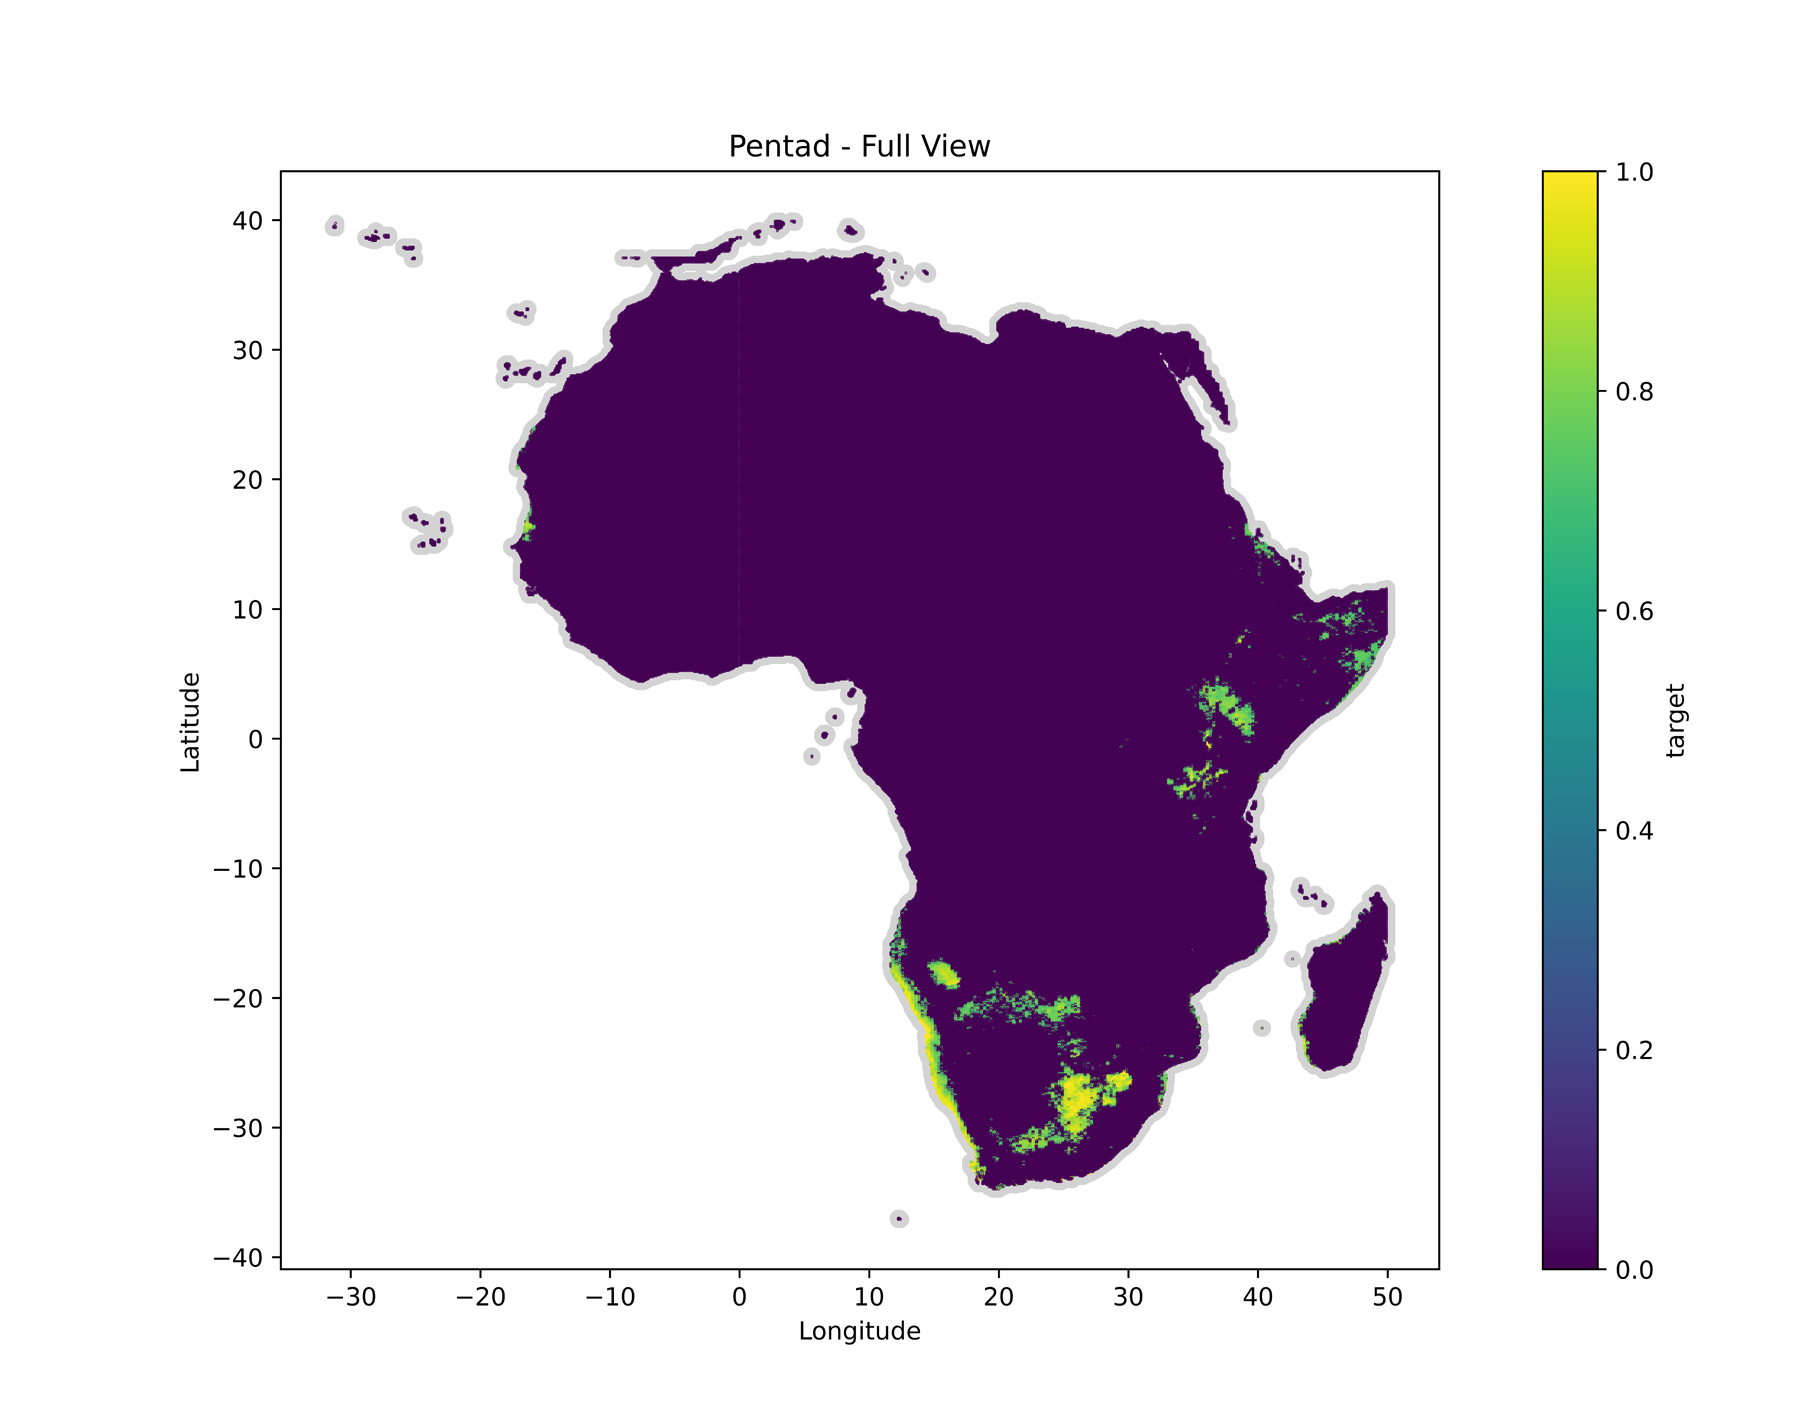
Figure 2: Africa Lesser Flamingo probability distribution map at a pentad scale, produced from BirdLasser location data at 2x2km grid scale, using iNaturalist and eBird as absence data only. This represents the predicted range for the 2016-2023 period. Map from Lee 2024.
A restricted interchange of an estimated 3–4 individuals per generation is estimated between the East and Southern African populations (Zaccara et al. 2008, Zaccara et al. 2011).
The species relies on a network of suitable alkaline, saline wetlands and coastal areas in Southern Africa during the non-breeding season (McCulloch 2003). It is nomadic and moves, usually at night, in response to local environmental changes at wetlands.
The species’ non-breeding distribution in South Africa is mainly the central Highveld, but it also occurs along the west and south coasts (Figure 3). Large numbers have been recorded at Kamfers Dam (KBA7099), the Berg River Estuary (KBA7158, Ramsar site no. 2466), West Coast National Park and Saldanha Bay islands (KBA7159, Ramsar site no. 398), iSimangaliso Wetland Park (KBA44662, Ramsar site no. 345), and Allanridge near Welkom (Anderson 2015a, Marnewick et al. 2015) as well as Chatty and Redhouse Saltpans near Gqeberha (formerly Port Elizabeth). It is a vagrant to and Lesotho (Anderson 2015a).
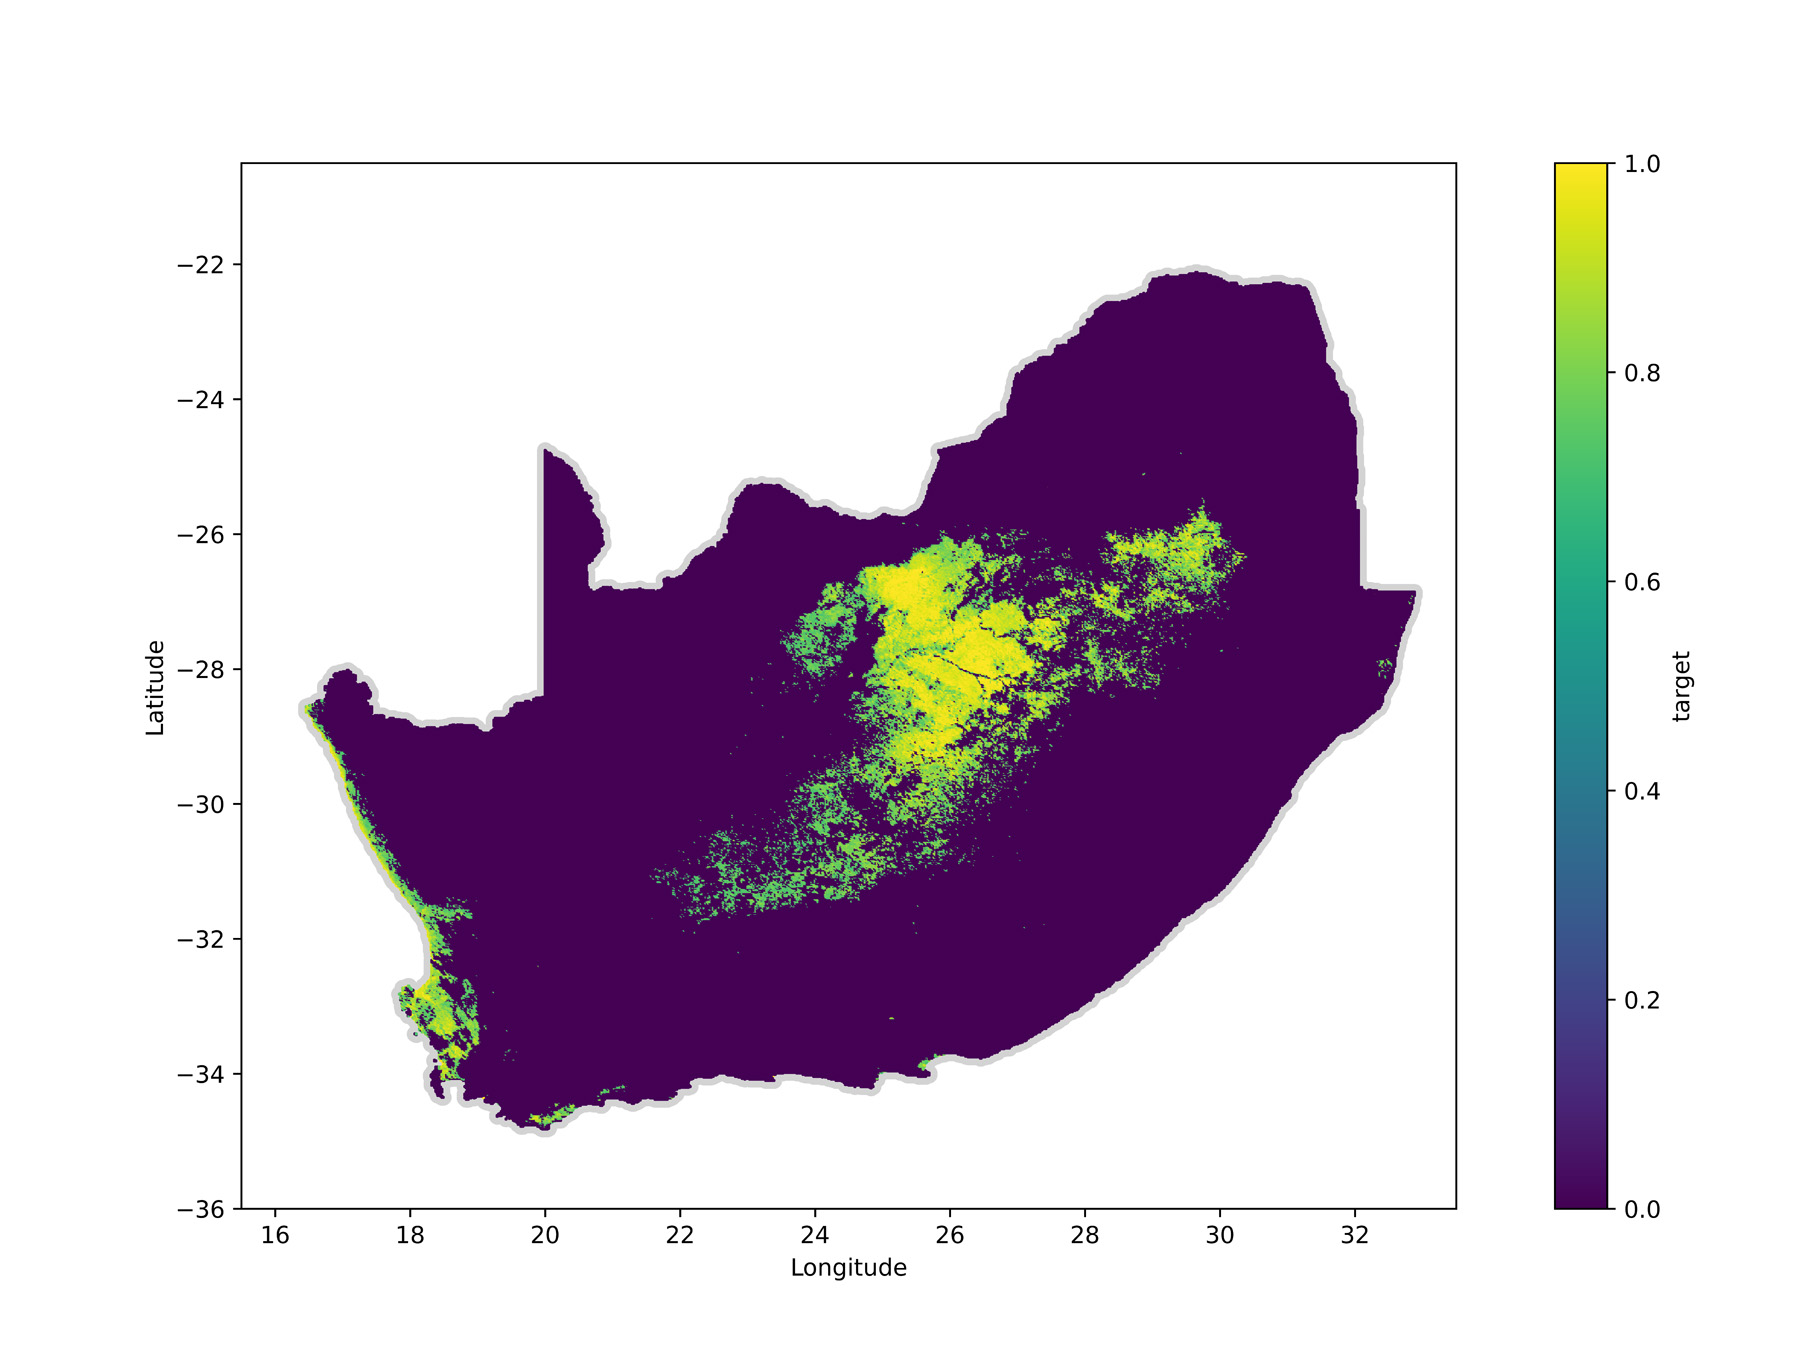
Figure 3. South Africa Lesser Flamingo probability distribution map, produced from BirdLasser location data at 2x2km grid scale, using iNaturalist and eBird as absence data only. This represents the predicted range for the 2016-2023 period at p>0.5 (from Lee 2024).
Before 2007, the only regular breeding sites in Africa were Lake Natron (Tanzania), Etosha Pan (Namibia) and Sua Pan (Botswana) (McCulloch and Irvine 2004). At least 12 breeding attempts at other sites in South Africa were unsuccessful (Brooke 1984, Anderson 2000), mainly because the sites are small, with low numbers of flamingos, and therefore unsuitable for mass breeding (Simmons 1996). Successful breeding in South Africa occurred in 2007 to 2010 after an island was constructed at Kamfers Dam inspired by observations of two breeding attempts in 1961 and 2003 (Anderson 2008, Anderson and Anderson 2010, Anderson et al. 2011). Thereafter, they bred successfully on the dam’s shoreline from 2018 to 2020 (Anderson 2018, 2020). Kamfers Dam is no longer suitable as a breeding site from 2020, and the current management measures are not resulting in the improvement of the habitat quality nor are likely to in the foreseeable future.
Ecology
The Lesser Flamingo occurs on open, eutrophic, shallow saline-alkaline wetlands, such as salt pans and coastal lagoons and estuaries (Brown et al. 1982, BirdLife International 2024a). It occurs in very large flocks, often with Greater Flamingos (Berry 1972, Anderson and Anderson 2017). Regular seasonal nomadic movements, mostly between Sua Pan, Kamfers Dam and Mozambique, and partial migration to Madagascar has been recorded (McCulloch et al. 2003, Pretorius et al. 2020). There is also evidence of partial migration within South Africa (Harebottle et al. unpubl data). Birds moving north to Sua Pan from Kamfers Dam do so via stopover sites such as Barberspan (McCulloch et al. 2003).
The species feeds by wading in shallow water, with bill upside-down, filtering cyanobacteria from the water surface, and small diatoms from the mud surface (Berry 1972). At Sua Pan large flocks congregate along the shallow edges of the flooded pan, filtering a mix of predominantly Phormidium and Oscillatoria cyanobacteria and diatoms (Krienitz et al. 2016). At Kamfers Dam, the predominant prey is the cyanobacteria Arthrospira fusiformis and diatoms (Anderson and Anderson 2010, Krienitz et al. 2016).
Sexual maturity is reached at 3–4 years (del Hoyo et al. 2020). The species is a colonial nester, with colonies numbering tens of thousands, often mixed with Greater Flamingos (Simmons 2005). Nest turrets of varying height are constructed on mud and salt islands in flooded pans (Berry 1972). Breeding takes place usually during the summer months after pans are inundated but may extend into winter. Importantly, breeding is only initiated following sufficient flooding after 300–400 mm of summer rainfall (McCulloch et al. 2010, Simmons 2015). Breeding at these sites is also reliant on inaccessibility to predators, an abundance of food and freshwater (Krienitz et al. 2016). Breeding success is highly variable.
The largest and most prolific breeding site is Sua Pan. Large breeding attempts are sporadic, usually occurring at least once every five years, and with varying success that is principally tied to flooding extent and period of flooding around the breeding colonies affording the eggs and chicks protection from predators (McCulloch and Borello 2000, McCulloch and Irvine 2004). One egg is laid, very rarely two. Chicks leave the nest at c. six days old and join crèches. Many chicks and eggs are lost when the waterbody dries up before the chicks are fledged, and thus breeding success is often low (McCulloch 2003). Fledgling survival rate is higher in exceptional rainfall years (McCulloch et al. 2010). Etosha Pan and Kamfers Dam are the only other two breeding sites that support both feeding and breeding concentrations of Lesser Flamingos. Breeding is only successful once every 7.1 years at Etosha Pan (Simmons 2015). There is insufficient data to estimate annual mortality and survival (Childress et al. 2008).
The Lesser Flamingo is highly dependent on its three Southern African breeding sites. The South African site (Kamfers Dam) is not formally protected. It is suspected that, if there are no breeding events at Kamfers Dam in future, the regional population may become a sink for the Southern African population. If the recruitment rates of the Namibian and Botswana populations remain too low to sustain the population, the Southern African population will also decline further and may not be able to rescue the regional population. It is suspected that poor recruitment has continued over the past 10–15 years due to fewer and smaller breeding events in Namibia and Botswana (Simmons 2015). There may be the potential for infrequent rescues from an extra-regional population because a mass influx from East Africa was suggested as the reason for large numbers in the early 1970s, not seen since (Simmons 1996). Zaccara et al. (2011) posit an estimated restricted migration of 3–4 individuals per generation from East Africa to southern Africa, which would be insufficient numbers to rescue the regional population. Without the creation of suitable stopover sites, a rescue effect is considered unlikely.
Threats & Conservation
Threats
The primary concern for the continued survival of the species is the loss or degradation of its specialised breeding and feeding habitats through altered hydrology and water quality, wetland pollution, extraction of salt, the disruption of its few breeding colonies by human activities, disturbance by low-flying aircraft, collisions with fences and utility lines, and the impacts of climate change (Brooke 1984, Simmons 1996, 1997, Childress et al. 2008, Anderson and Anderson 2017).
Only an estimated 16% of Lesser Flamingo are recorded in formally protected areas, with 8% in partially protected areas and 76% in unprotected areas (Lee 2024). Kamfers Dam has been unsuitable for feeding and breeding since 2020 due to poor municipal management of wastewater treatment infrastructure (Roos 2021). In addition, many of the Lesser Flamingo feeding sites are threatened as these small, shallow inland wetlands are vulnerable to climate change and pressures, such as water abstraction, water pollution and sedimentation (van Deventer et al. 2019). An estimated 80% of South Africa’s inland wetlands are threatened and unprotected; with increasing anthropogenic pressures (van Deventer et al. 2019). These include many of the Lesser Flamingo feeding sites.
Anthropogenic disturbance leads to abandonment of nesting sites. Depredation by stray domestic dogs and hunting are continuous threats at Kamfers Dam (Anderson and Anderson 2017), and intrusions by dogs into breeding colonies cause breeding abandonment. Based on field counts, these disturbance events resulted in the loss of 40% of active nest sites in one breeding event (Colyn et al. 2024). Reduced treated sewage effluent inflow into Kamfers Dam during an extended drought in 2019 resulted in a premature chick and egg rescue operation undertaken by the local community which unintentionally caused further nest abandonment (Colyn et al. 2024). The rescue was initiated due to animal welfare concerns, and was partially successful, with 24% of the chicks repatriated to Kamfers Dam (Anderson 2024). Continual proposals for housing developments on adjacent properties to Kamfers Dam are a potential threat to the dam’s flamingos.
Flamingo collisions with powerlines and telephone lines near wetlands continue across the region (Jenkins et al. 2010). Emerging threats include drones (which could cause significant disturbance at breeding sites if they are used frequently at low levels) (Anderson and Anderson 2017) and collision with solar facilities which are perceived as wetlands.
Climate change is an increasing concern (BirdLife International 2024b). Dramatic changes in distribution are expected over the next few decades, with a higher impact of climate change on wetlands along the borders of their distribution through extended droughts and aridification (Delfino 2023, Engelbrecht et al. 2024). The predictions for Sua Pan and Etosha Pan are that increased drought intensity or frequency will reduce the breeding window periods for the species to the detriment of the population (Simmons et al. 2004, Childress et al. 2007, McCulloch et al. 2010). Reduced or cessation of breeding at these sites will have direct consequences on the regional population. Within South Africa the predictions are for a warmer and drier climate, with an increase in the number of ‘heat-wave days’ in the central regions of South Africa (Engelbrecht et al. 2024). Extreme climate events generally negatively impact flamingos. Severe cold spells caused the death of juveniles at Kamfers Dam in July 2020, likely from starvation due to lower prey resources and higher energetic requirements (E. van der Westhuizen-Coetzer pers obs).
There is some evidence of the effects of pathogens and pollutants on this species (Diamond Fields Advertiser 2013a, Bega 2025). Avian pox virus (subclade A3) was documented at Kamfers Dam (Zimmermann et al. 2011), and its spread could be exacerbated by deteriorating water quality and proliferation of biting insects at wetlands frequented by Lesser Flamingos. It is not known whether the more virulent subclade B2 of the avian pox virus, previously only recorded in captive birds and rescued flamingo chicks in a few rehabilitation centres (Koeppel 2020), was introduced into the flamingo population at Kamfers Dam through repatriated immatures in 2019. Highly pathogenic avian influenza (HPAI) presence in Lesser Flamingos has not yet been determined (CMS FA0 2023). However, their sympatric relationship with Greater Flamingos, in which HPAI has been detected in eastern Europe (Karamendin et al. 2020), could result in transmission events.
An avian botulism Clostridium botulinum outbreak killed hundreds of flamingos and other waterbirds at Kamfers Dam in 2013 and 2024 (Diamond Fields Advertiser 2013a, 2013b, Bega 2025). Aeromonas hydrophila bacteria caused the death of many sympatric waterbirds, but not flamingos, at Kamfers Dam in 2021. High levels of iron lead to immunosuppression and malnutrition which likely made them more susceptible to bacteria (E. van der Westhuizen-Coetzer pers comm). There is the potential that this bacterium could also affect flamingos should they be immunocompromised.
Chemical toxicants, biological toxins, and pollutants are considered a highly important health issue for 62% of avian species groups (Kipperman et al. 2024). Persistent Organic Pollutants (POPs) may be affecting flamingo health and breeding, but not much is known about sensitivity levels of flamingos, and the intensity of pollution of many of their habitats. DDT has been found to be present in eggs of Lesser Flamingos in Etosha Pan. A study at Kamfers Dam has found DDT and its metabolite 2,4′-DDE and Polychlorinated Biphenyls in Lesser Flamingos (Hill et al. 2013). The effects of a chronic low dose exposure on such long-lived birds, let alone a mixture of POPs, are unknown. At higher levels DDT can cause eggshell thinning which could be very detrimental to the flamingos since they breed so infrequently. The possible negative effects of the ingestion of heavy metals, such as lead, copper and zinc present in Kamfers Dam (Roos 2021) on flamingos are not known. Possible impacts from pharmaceutical pollution are unknown.
Conservation Measures Underway
Fatal flamingo collisions with the railway overhead electric lines at Kamfers Dam have been recorded since 2010. The first bird flight diverters to make the cables more visible were fitted in 2012, but they were ineffective. OWL devices with led lights and solar units, which are more effective at preventing collisions at night, were fitted to a section of powerlines in 2020 (Anderson and Anderson 2023). Their efficacy is yet to be determined.
A study to produce density estimates of breeding Lesser Flamingo at Kamfers Dam in 2019 applied machine learning that provided highly accurate counts from both drone and satellite imagery. The implementation of this method further afield could greatly improve the efficiency of monitoring and associated conservation efforts underway (Colyn et al. 2024).
A web cam was installed by Africam (2021) near the shoreline breeding site at Kamfers Dam in September 2021 to live stream flamingo activities and raise awareness.
The South Africa Flamingo Research and Conservation Group (SAFRCG) was established by BirdLife South Africa in 2021, replacing the Save the Flamingo Association which achieved some success in conserving Kamfers Dam between 2007 and 2020. The SAFRCG is currently monitoring the water quality and algal concentration of Kamfers Dam and working with the African-Eurasian Migratory Waterbirds (AEWA) and UN Environment Programme’s Convention on Migratory Species teams.
Conservation Measures Proposed
Collaboration between African countries is needed to implement the AEWA (2018) Plan for Action for Africa 2019-2027. Many recommendations in the International Single Species Action Plan (ISSAP) for the Conservation of the Lesser Flamingo (Childress et al. 2008) must still be implemented. The ISSAP has been extended to 2028.
The AEWA conservation brief (AEWA 2022) has reprioritised the ISSAP actions and provides additional actions to conserve the species. High priority actions include:
- Ensuring that all breeding sites and key non-breeding sites are restored or maintained in good ecological condition.
- Ensuring that key sites are not disturbed by human activity.
- Reducing the effects on regional populations of toxicological and/or infectious diseases.
- Minimising collisions with man-made structures.
- Systematically collect data on breeding and feeding habitat requirements including the role of rainfall.
- Regular monitoring of numbers at key sites to determine fluctuations and trends.
- Help local communities to develop alternative livelihood practices to reduce disturbance.
- Filling knowledge gaps of population, ecology and impacts of threats.
The Kamfers Dam breeding island should be reconstructed, and this wetland should be formally protected. A comprehensive management plan for Kamfers Dam must still be developed, especially to ensure that water quality and human disturbance issues are addressed. All the overhead cables around Kamfers Dam, and other key sites, should be marked with suitable devices. Disturbance by low-flying aircraft and drones must be prevented through legislation, zoning and enforcement. Pollution guidelines are needed and enforced for all pollutants.
Alternative sites should also be considered for the construction of more artificial breeding islands.
Research Priorities and Questions
The following research priorities and questions are recommended:
- Determine accurate estimates of the population size in South Africa, southern Africa and Africa. This can be enhanced using machine learning methods to determine flamingo numbers.
- Determine more accurate population sizes and trends by developing a monitoring strategy and protocols. Simultaneous population counts/estimates, at least every five years, across all African populations need to be undertaken for more accurate population numbers and to better understand fluctuations.
- Determine survival probability estimates for the regional population.
- Perform further satellite tracking to assess recent movements between southern and East Africa and get a better estimate of frequency and possibly migration numbers.
- Conduct a PVA once more accurate demographic data are available.
- Model long term effects of climate change on habitat and food availability and diseases.
- Investigate the relationship between flamingo numbers and cyanobacteria species composition and abundance. Investigate the water quality requirements to support a sustainable and healthy concentration of cyanobacteria.
- Assess the impacts of surface water and groundwater abstraction on flooding period at breeding sites.
- Investigate whether Lesser Flamingo have HPAI in the region.
- Investigate the effects of chemical toxicants, POPs, pharmaceutical pollutants, biological toxins and heavy metals on flamingos in the region.
Contributors & References
Assessor/s
Tania A. Anderson
Reviewer/s
Douglas M. Harebottle, Simmy Bezeng
References
Africam. 2021. Livestream flamingo activities at Kamfers Dam. Available at www.africam.com/wildlife/stream/flamingos. [Accessed May 2024].
Agreement on the Conservation of African-Eurasian Migratory Waterbirds (AEWA). 2018. AEWA Plan of Action for Africa 2019-2027. UNEP/AEWA Secretariat. Available at www.unep-aewa.org/sites/default/files/uploads/PoAA%202019_2027_web_en_200618 _fin.pdf. [Accessed May 2024].
Agreement on the Conservation of African-Eurasian Migratory Waterbirds (AEWA). 2022. Conservation Brief for the CMS/AEWA International Single Species Action Plan for the Conservation of the Lesser Flamingo Phoeniconaias minor. AEWA Technical Committee.
Available at www.unep-aewa.org/sites/default/files/document/aewa_mop8_inf_11_issap
_cons_brief_lesser_flamingo.pdf. [Accessed May 2024].
Anderson MD. 2000. The status of flamingos in the Northern Cape Province, South Africa. Ostrich 71: 430–434.
Anderson MD. 2008. A vision in pink: Lesser Flamingo breeding success. Africa – Birds & Birding 13(2): 42–49.
Anderson MD. 2015a. Lesser Flamingo. In: Taylor MR, Peacock F, Wanless RM (eds), The 2015 Eskom red data book of birds of South Africa, Lesotho and Swaziland. Johannesburg, South Africa: BirdLife South Africa. pp 305–307.
Anderson MD. 2015b. Happy Kamfers. African Birdlife 13(2): 28–33.
Anderson MD, Anderson TA. 2010. A breeding island for Lesser Flamingos Phoeniconaias minor at Kamfers Dam, Kimberley, South Africa. Bulletin of the African Bird Club 17: 225– 228.
Anderson MD, Anderson TA, McCulloch GP. 2011. Breeding and ringing reports: Greater Flamingo and Lesser Flamingo. Flamingo, Bulletin of the Flamingo Specialist Group 18: 1–3.
Anderson TA. 2018. Lesser Flamingos Baby Boom. African Birdlife Jan/Feb: 16.
Anderson TA. 2020. Better late than never. African Birdlife July/Aug 2020: 15.
Anderson TA. 2024. The Lesser Crimson wings. Promerops 328: 10–13.
Anderson TA, Anderson MD. 2017. Man’s impacts on flamingos. In: Anderson MJ (ed), Flamingos: Behaviour, Biology and Relationship with Humans. Nova Publishers. pp 199–226.
Anderson TA, Anderson MD. 2023. An Annotated Checklist of the Birds of the Kimberley Region. Available at www.sabap2.birdmap.africa/docs/2023_Annotated_Checklist
_Kimberley.pdf. [Accessed on May 2024].
Bega S. 2025. Sewage crisis at Kamfers Dam causes ‘biodiversity nightmare’ for waterbirds. Available at https://mg.co.za/the-green-guardian/2025-01-15-sewage-crisis-at-kamfers-dam-causes-biodiversity-nightmare-for-waterbirds/ [Accessed on 15 January 2025].
Berry HH. 1972. Flamingo breeding on the Etosha Pan, South West Africa, during 1971. Madoqua 5: 5–31.
BIRDIE. 2024. An online platform for African wetland and waterbird data. https://biodiversityadvisor.sanbi.org/contentmanagement/index?guid=42305260-12b0-4a92-912e-7d801d15fdac. [Accessed on 30 September 2024].
BirdLife International. 2018. Phoeniconaias minor. The IUCN Red List of Threatened
Species 2018: e.T22697369A129912906. Available at dx.doi.org/10.2305/IUCN.UK.2018-
2.RLTS.T22697369A129912906.en. [Accessed on May 2024].
BirdLife International. 2024a. Species factsheet: Phoeniconaias minor. Available at www.datazone.birdlife.org/species/factsheet/lesser-flamingo-phoeniconaias-minor. [Accessed on May 2024]
BirdLife International. 2024b. Climate change. Available at www.birdlife.org/climate-change. [Accessed on May 2024]
Brooke RK. 1984. The South African red data book – birds. South African Scientific Programme Report 97. Pretoria, South Africa: CSIR.
Brown LH, Urban EK, Newman K. 1982. The Birds of Africa, Volume I. London: Academic Press.
Childress B, Hughes B, Harper D, van den Bossche W. 2007. East African flyway and key site network of the Lesser Flamingo (Phoenicopterus minor) documented through satellite tracking. Ostrich 78(2): 463–468.
Childress B, Nagy S, Hughes B. 2008. International Single Species Action Plan for the Conservation of the Lesser Flamingo (Phoeniconaias minor). Convention on the Conservation of Migratory Species of Wild Animals (CMS) Agreement on the Conservation of African-Eurasian Migratory Waterbirds (AEWA).
CMS FAO Co-convened Scientific Task Force on Avian Influenza and Wild Birds. 2023. Scientific Task Force on Avian Influenza and Wild Birds statement on H5N1 high pathogenicity avian influenza in wild birds – Unprecedented conservation impacts and urgent needs. Available at www.cms.int/en/workinggroup/scientific-task-force-avian-influenza-and-wild-birds. [Accessed on May 2024]
Colyn R, Anderson T, Anderson M, Retief E, Van der Westhuizen-Coetzer E, Smit-Robinson H. 2024. The use of image classification to estimate flamingo abundance from aerial, drone and satellite imagery. Ostrich 1–12. Available at https://doi.org/10.2989/ 00306525.2024.2325674. [Accessed on 5 July 2024].
Delany S, Scott D 2006. Waterbird population estimates. 3rd edn. Wetlands International Global Series No 12. The Netherlands: Wageningen.
Delfino HC. 2023. A fragile future for pink birds: habitat suitability models predict a high impact of climate change on the future distribution of flamingos. Emu – Austral Ornithology,123(4): 310–324. Available: www.doi.org/10.1080/01584197.2023.2257757. [Accessed on 6 May 2024].
del Hoyo J, Boesman PFD, Garcia EFJ and Kirwan, GM. 2020. Lesser Flamingo (Phoeniconaias minor), version 1.0. In: del Hoyo J, Elliott A, Sargatal J, Christie DA, de Juana E (eds), Birds of the World. Ithaca, NY, USA: Cornell Lab of Ornithology. Available: www.doi.org/10.2173/bow.lesfla1.01. [Accessed on 6 May 2024].
Deville AS, Labaude A, Robin J, Béchet A, Gauthier-Clerc M, Porter W, Fitzpatrick M, Mathewson P, Grémillet D. 2014. Impacts of extreme climatic events on the energetics of long-lived vertebrates: the case of the greater flamingo facing cold spells in the Camargue. Journal of Experimental Biology 217: 3700–3707.
Diamond Fields Advertiser. 2013a. Outbreak – Botulism is one of the most dangerous toxins known to man. Diamond Fields Advertiser 4 December: 1–3.
Diamond Fields Advertiser. 2013b. Expert confirms Kamfers Dam birds’ cause of death. Diamond Fields Advertiser 11.
Dodman T. 2014. Status, estimates and trends of waterbird populations in Africa: AEWA-listed African populations (CSR6 African populations). Wetlands International.
Engelbrecht FA, Steinkopf J, Padavatan J, Midgley GF. 2024. Projections of Future Climate Change in Southern Africa and the Potential for Regional Tipping Points. In: von Maltitz GP, Midgley GF, Veitch J, Brummer C, Rotter RP, Viehberg FA, Veste M (eds), Sustainability of Southern African Ecosystems under Global Change. Springer. pp 169–190.
Groom G, Krag Petersen I, Anderson MD, Fox AD. 2011. Using object-based analysis of image data to count birds: mapping of Lesser Flamingos at Kamfers Dam, Northern Cape, South Africa. International Journal of Remote Sensing 32: 4611–4639.
Harper DM, Childress RB, Harper MM, Boar RR, Hickley P, Mills SC, Otieno N, Drane T, Vareschi E, Nasirwa O, Mwatha WE, Darlington JPEC, Escuté-Gasulla X. 2003. Aquatic biodiversity and saline lakes: Lake Bogoria National Reserve, Kenya. Hydrobiologica 500 (1): 259–276.
Harper M. 2018. How the battle to save Lake Natron was won. Available at www.community.rspb.org.uk/ourwork/b/martinharper/posts/lake-natron. [Accessed on 6 May 2024].
Hill LM, Bowerman WW, Roos JC, Bridges WC, Anderson MD. 2013. Effects of water quality changes on phytoplankton and lesser flamingo Phoeniconaias minor populations at Kamfers Dam, a saline wetland near Kimberley, South Africa. African Journal of Aquatic Science 38: 287–294.
IUCN Standards and Petitions Committee. 2024. Guidelines for Using the IUCN Red List Categories and Criteria. Version 16. Prepared by the Standards and Petitions Committee. Available at https://www.iucnredlist.org/documents/RedListGuidelines.pdf. [Accessed on 6 May 2024].
Jenkins AR, Smallie JJ, Diamond M. 2010. Avian collisions with power lines: a global review of causes and mitigation with a South African perspective. Bird Conservation International 20: 263–278. Available: www.doi/org/10.1017/S0959270910000122.
Karamendin K, Kydyrmanov A, Kasymbekov Y, Daulbayeva K, Khan E, Seidalina A, Sayatova M. 2020. A Highly Pathogenic H5N1 Influenza A Virus Isolated from a Flamingo on the Caspian Sea Shore. Microbiology Resource Announcements 9(39). Available: www.doi.org/10.1128/MRA.00508-20. [Accessed on 6 May 2024].
Kipperman MJ, Beckmann KM, Anderson NE, Meredith AL, Cromie RL. 2024. Migratory Species and Health: a review of migration and wildlife disease dynamics, and health of migratory species, within the context of One Health. University of Edinburgh report to the Secretariat of the Convention on the Conservation of Migratory Species of Wild Animals. Available: www.cms.int/sites/default/files/document/cms_cop14_inf.30.4.3_e_0.pdf. [Accessed on 6 May 2024].
Kock ND, Kock RA, Wambua J, Kamau GJ, Mohan K. 1999. Mycobacterium avium-related epizootic in free-ranging lesser flamingos in Kenya. Journal of Wildlife Diseases 35: 297–300.
Koeppel KN. 2020. Pox virus in Lesser Flamingo from Kamfers Dam, Northern Cape. Unpublished report.
Kootsositse MV. 2012. Restoring a disappearing site in Botswana. BirdLife Africa Newsletter 13.5: 30.
Krienitz L, Krienitz D, Dadheech P, Hübener T, Kotut K, Luo W, Teubner K, Versfeld W. 2016. Food algae for Lesser Flamingos: a stocktaking. Hydrobiologia 775: 21–50. Available: www.link.springer.com/article/10.1007/s10750-016-2706-x. [Accessed on 6May 2024].
Lee ATK. 2024. Regional Red Data Book of the Birds of South Africa, Lesotho and Eswatini: SABAP2 synthesis and supporting information and graphics for Lesser Flamingo. Unpublished report: BirdLife South Africa, Johannesburg.
Marnewick MD, Retief EF, Theron NT, Wright DR, Anderson, TA. 2015. Important Bird and Biodiversity Areas of South Africa. Johannesburg: BirdLife South Africa.
McCulloch GP. 2003. The ecology of Sua pan and its flamingo populations. PhD thesis. Trinity College (Dublin, Ireland). Department of Zoology.
McCulloch GP, Aebischer A, Irvine K. 2003. Satellite tracking of flamingos in southern Africa: the importance of small wetlands for management and conservation. Oryx 37: 480– 483.
McCulloch GP, Borello WD. 2000. The importance of the Makgadikgadi salt pans in Botswana for flamingos in Africa. Waterbirds: The International Journal of Waterbird Biology 23: 64–68.
McCulloch GP, Hancock P, Soopu J, Rutina L. 2010. Makgadikgadi Pans Important Bird Area monitoring report 2009. Babbler Special Supplement 3.
McCulloch GP, Irvine K. 2004. Breeding of Greater and Lesser Flamingos at Sua Pan, Botswana, 1998-2001. Ostrich 75: 236–242.
Moreno-Opo R, Ould Sidaty ZE, Baldó JM, García F, Ould Sehla Daf D, González LM. 2013. A breeding colony of the Near Threatened Lesser Flamingo Phoeniconaias minor in western Africa: a conservation story of threats and land management. Bird Conservation International 23: 426–436.
Muchira N. 2018. Tanzania shelves Lake Natron soda ash project. Available: www.theeastafrican.co.ke/tea/business/tanzania-shelves-lake-natron-soda-ash-project-1387878. [Accessed on 6 May 2024].
Nagy S, Langendoen T. 2020. Flyway trend analyses based on data from the African-Eurasian Waterbird Census from the period of 1967-2018. Wageningen, The Netherlands: Wetlands International. Available: www.iwc.test.wetlands.org/ index.php/aewatrends8. [Accessed on 6 May 2024].
Ndetei R, Muhandiki V. 2005. Mortalities of lesser flamingos in Kenyan Rift Valley saline lakes and the implications for sustainable management of lakes. Lakes & Reservoirs: Research & Management 10:51–58.
Omara T, Nagawa CB, Kyarimpa C, Böhmdorfer S, Rosenau T, Lugasi SO, Matovu H, Odongo S, Ssebugere P. 2023. Lacustrine Cyanobacteria, Algal Blooms and Cyanotoxins in East Africa: Implications for Human and Ecological Health Protection. Phycology 3: 147– 167.
Pretorius MD, Leeuwner L, Tate GJ, Botha A, Michael MD, Durgapersad K, Chetty. 2020. Movement patterns of lesser flamingos Phoeniconaias minor: nomadism or partial migration? Wildlife Biology 2020: 1–11.
Roos JC. 2021. Kamfers Dam water quality summary report 2019-2021. Unpublished report.
Simmons RE. 1996. Population declines, viable breeding areas, and management options for flamingos in southern Africa. Conservation Biology 10: 504–514.
Simmons RE. 1997. The Lesser Flamingo in southern Africa – a summary. In: G Howard (ed), Conservation of the lesser flamingo in East Africa and beyond. pp 50–61. IUCN East Africa, Lake Bogoria, Nairobi, Kenya.
Simmons RE. 2000. Declines and movements of lesser flamingos in Africa. Waterbirds: The International Journal of Waterbird Biology 23: 40–46.
Simmons RE. 2005. Lesser Flamingo Phoenicopterus minor. In: Hockey PAR, Dean WRJ, Ryan PG (eds), Roberts – Birds of Southern Africa, 7th Edn. Cape Town, South Africa: The Trustees of the John Voelcker Bird Book Fund. pp 606–607.
Simmons RE. 2015. Lesser Flamingo Phoeniconaias minor. In: Simmons RE, Brown CJ, Kemper J (eds), Birds to watch in Namibia: red, rare and endemic species. Windhoek: Ministry of Environment and Tourism and Namibia Nature Foundation. pp 170–172.
Simmons RE, Barnard PE, Dean WRJ, Midgley GF, Thuiller W, Hughes G. 2004. Climate change and birds: perspectives and prospects from southern Africa. Ostrich 75: 295–308.
van Deventer H, Smith-Adao L, Collins NB, Grenfell M, Grundling A, Grundling PL, Impson D, Job N, Lötter M, Ollis D, Petersen C, Scherman P, Sieben E, Snaddon K, Tererai F, Van der Colff D. 2019. South African National Biodiversity Assessment 2018: Technical Report. Volume 2b: Inland Aquatic (Freshwater) Realm. South African National Biodiversity Institute, Pretoria: CSIR report number CSIR/NRE/ECOS/IR/2019/0004/A.
Williams AJ, Velásquez C. 1997. Lesser Flamingo Phoeniconaias minor. In: Harrison JA, Allan DG, Underhill LG, Herremans M, Tree AJ, Parker V, Brown CJ (eds), The atlas of southern African birds Vol I: Non-passerines. Johannesburg, South Africa: BirdLife South Africa. pp 114–115.
Zaccara S, Crosa G, Childress B, McCulloch GP, Harper DM. 2008. Lesser Flamingo Phoenicopterus minor populations in eastern and southern Africa are not genetically isolated. Ostrich 79(2): 165–170.
Zaccara S, Crosa G, Vanetti I, Binelli G, Brooks C, McCulloch GP, Harper DM. 2011. Lesser flamingo (Phoeniconaias minor) as a nomadic species in African shallow alkaline lakes and pans: genetic structure and future perspectives. Ostrich 82: 95–100.
Zimmermann D, Anderson MD, Lane E, Van Wilpe E, Carulei O, Douglass N, Williamson AL, Kotze A. 2011. Avian poxvirus epizootic in a breeding population of Lesser Flamingos (Phoenicopterus minor) at Kamfers Dam, Kimberley, South Africa. Journal of Wildlife Diseases 47: 989–993.
Appendix
LESSER FLAMINGO ADDITIONAL INFORMATION
Population decline estimates – Criterion A.
Assumptions:
- Assumed constant exponential decline, but it is unknown whether this is true.
- The data assumed to be the most reliable were selected.
- For the first exponential model, two points in time based on a machine learning count (Groom et al. 2011) and breeding counts and the CWAC counts for those two years were combined to get a maximum count.
- For the second exponential model, the longest period between CWAC counts was used. The sum of the seasons with the highest count was used for these years. The seasons were not summed for a mean annual count to avoid double-counting.
- Generation time = 15.5 years. Assessment year = 2024. Assessment period = 46.5 years. Three generations ago = 1977.5
Table 1. Calculating three generation decline with exponential assumption and only two years of data (Criterion A workbook 2018).
|
Year 1 |
Population in year 1 |
Year 2 |
Population in year 2 |
# years between 3-gen ago and Year1 |
# years btw Year2 and present |
# years btw estimates |
Annual change |
Change btw 3-gen ago & Yr1 |
Change btw Yr2 & present |
Population 3 gen ago:1977.5 |
Population current:2024 |
3-gen change |
|
2006 |
83 465 |
2018 |
50 106 |
28.5 |
6 |
12 |
95.84% |
30% |
77% |
280 440 |
38 822 |
-86.2% |
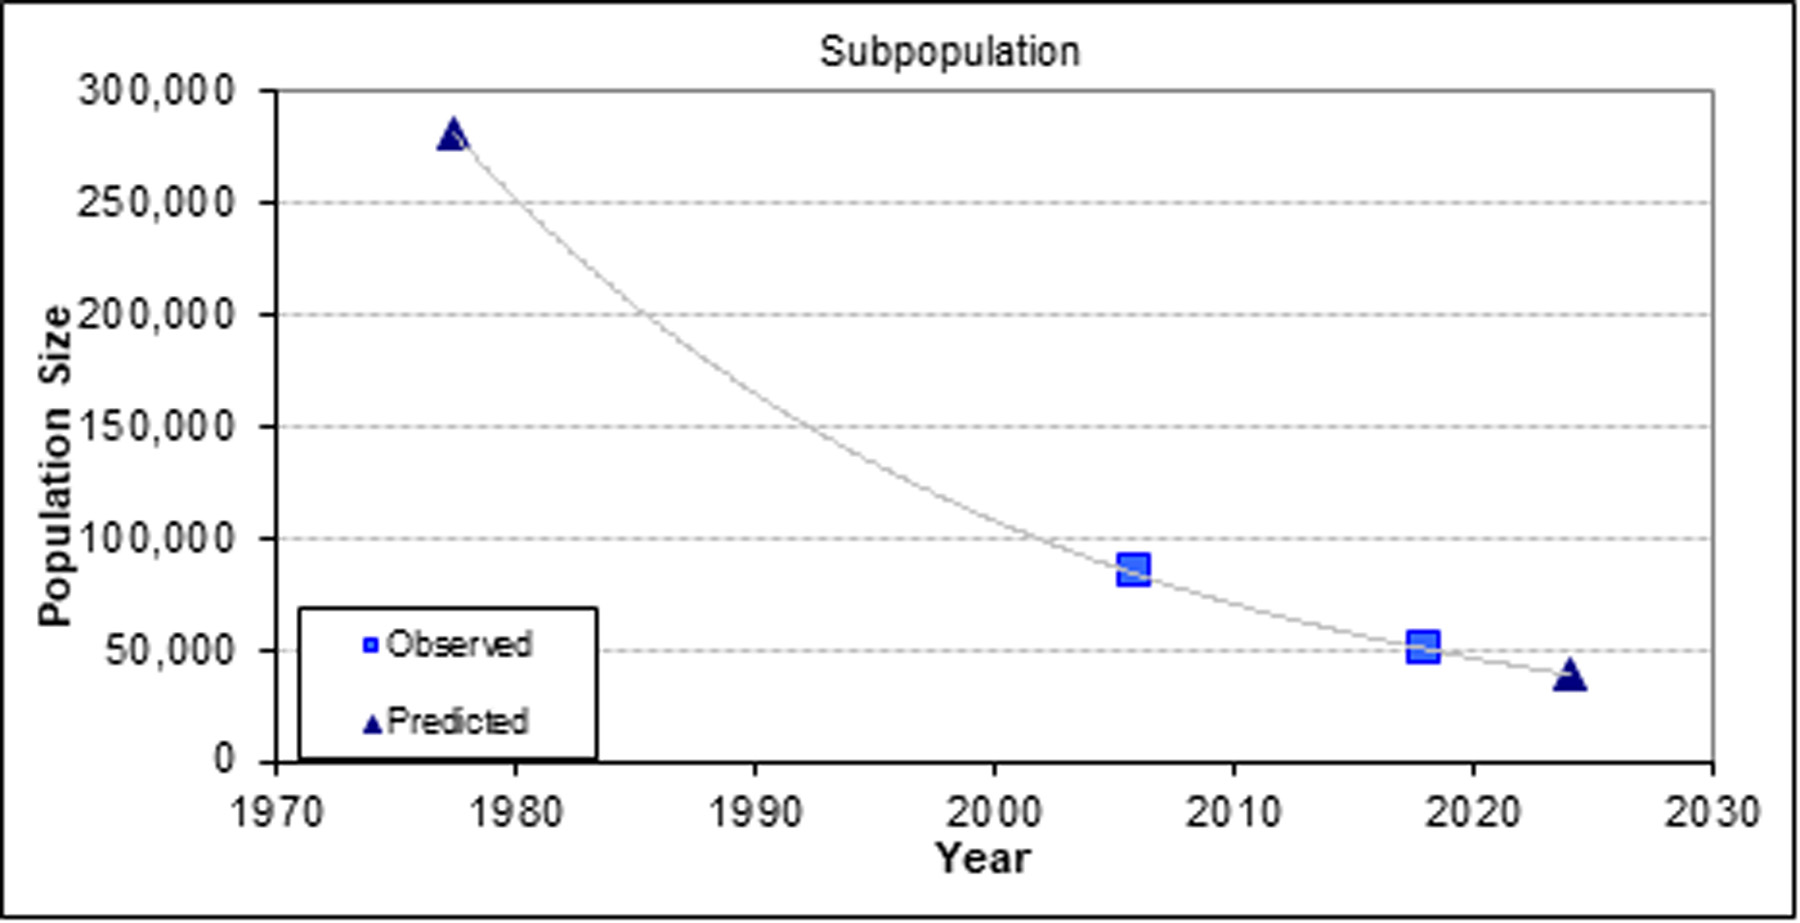
Figure 1: Exponential decline based on data from Groom et al. 2011, breeding counts in summer and CWAC counts.
Table 2. Calculating three generation decline with exponential assumption and only two years of data (Criterion A workbook 2018). Data from CWAC counts (highest seasons count) 25 years apart to try distinguish between fluctuations and a directional change.
|
Year 1 |
Population in year 1 |
Year 2 |
Population in year 2 |
# years between 3-gen ago and Year1 |
# years btw Year2 and present |
# years btw estimates |
Annual change |
Change btw 3-gen ago & Yr1 |
Change btw Yr2 & present |
Population 3 gen ago: |
Population current: |
3-gen change |
|
1998 |
8 492 |
2023 |
7 348 |
20.5 |
1 |
25 |
99.42% |
89% |
99% |
9 562 |
7 306 |
-23.6% |
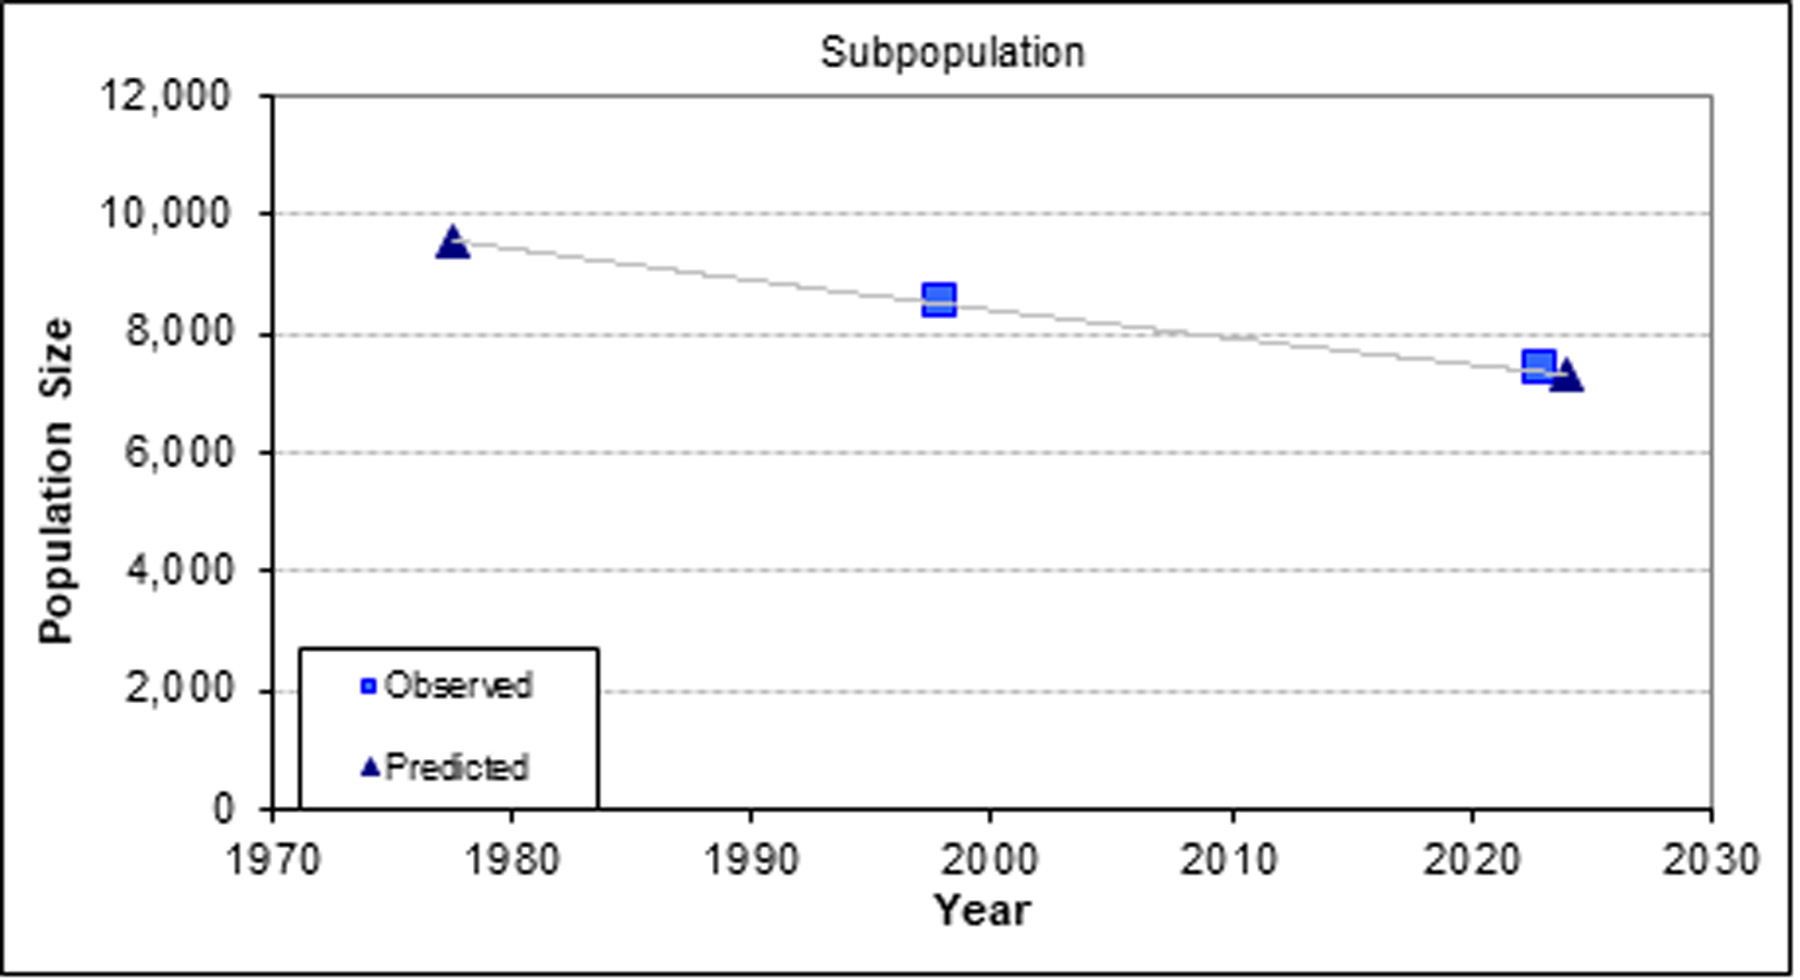
Figure 2: Exponential decline based on two CWAC data points 25 years apart.
Results:
The population decline rate is from 83.2% (CR) to 23.6% (LC) according to these results.
The lower bound of a 24% reduction was used due to the uncertainties. The upper bound may be the result of natural fluctuations.
Other models used:
The multiple populations exponential decline model (Criterion A workbook 2018) and a polynomial regression with four years of counts between 1999 and 2022 (IUCN Red List guidelines) was used to calculate decline over 3 generations, but both returned results that indicate they were not suitable models to use for the species (possibly due to different methods of data estimates/ inference or the directional change is not exponential or constant).
Extreme fluctuations in mature individuals – Criterion B
Assumptions:
- It was assumed that counts were mostly of mature individuals as there were no counts of immatures in CWAC data.
- We suspect the region’s population is a portion of one large population that moves around Southern Africa, but for a regional assessment we must consider the regional subpopulation fluctuations as partly due to movements to extra-regional subpopulations in other Southern Africa regions.
- It is suspected that the most reliable data from CWAC counts are from the years 1999 to 2019 when > 100 surveys were done per season for most years. The mean number of surveys/ season from 1998 to 2023 is 111 (range 72 -162). The maximum total count in this period was 71 700 and minimum was 2 207.
- The large wetlands divided into several CWAC sites for counts (for eg. the Berg River Estuary which has eight sites) were combined when doing calculations because not all of these locations were surveyed every year or regularly, and they were combined into one survey for some years.
Figure 3 illustrates the highest of two seasons’ CWAC counts per year from 1998 to 2023. The total annual count is not used to avoid double-counting due to movements between sites. The highest counts for 22 of the 26 years were in winter when the flamingos are more dispersed across the region.
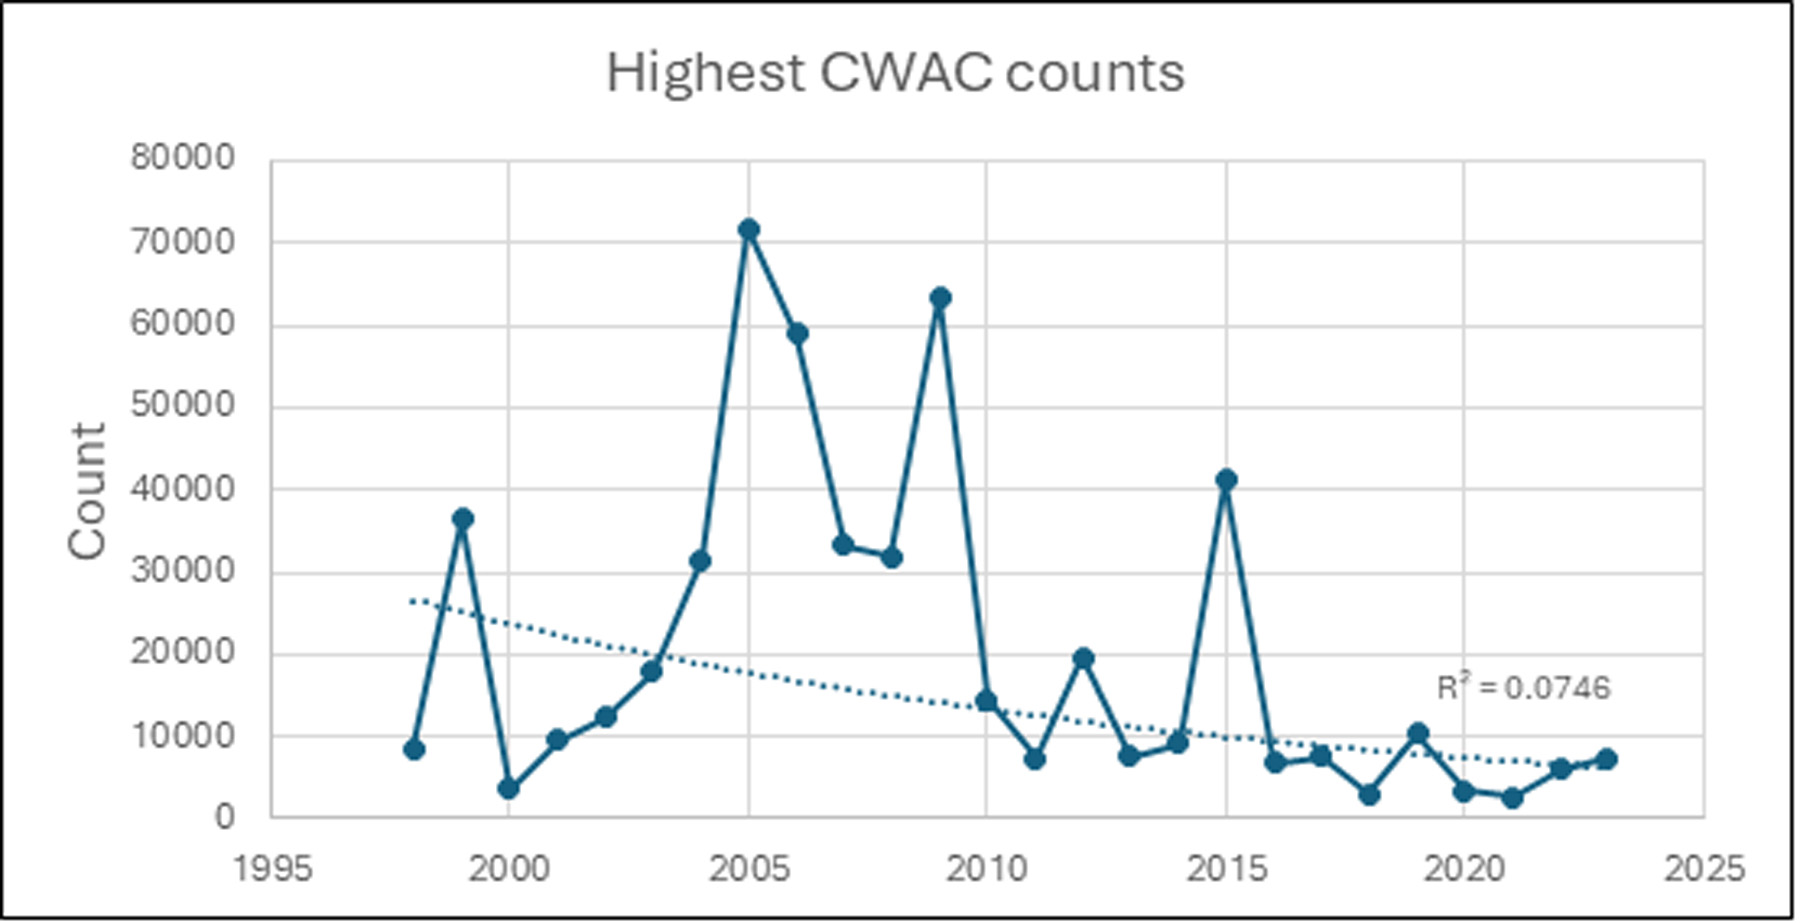
Figure 3: Illustrating large annual fluctuations in numbers of individuals. The exponential trendline shows a decline over 26 years (1998-2023).
Fluctuations in total population from the highest season CWAC counts/annum indicate 13 years of more than 10-fold changes in numbers over various periods. The intervals between years vary from 1 through to 22-year periods.
Table 3. A sample of 9 years with more than 10-fold changes in numbers of individuals over various periods between years.
|
Year 1 |
Count |
Year 2 |
Count |
Period between yrs (yrs) |
|
1999 |
36414 |
2000 |
3617 |
1 |
|
2015 |
41189 |
2018 |
2960 |
3 |
|
2015 |
41189 |
2020 |
3452 |
5 |
|
2008 |
31883 |
2018 |
2960 |
10 |
|
2009 |
63472 |
2020 |
3452 |
11 |
|
2006 |
58989 |
2018 |
2960 |
12 |
|
2007 |
33290 |
2021 |
2664 |
14 |
|
2005 |
71700 |
2022 |
6009 |
17 |
|
1999 |
36414 |
2021 |
2664 |
22 |
Fluctuations in total population counts at CWAC sites change more than 10-fold between summer and winter in many years.
Table 4: A sample of years with 10-fold reductions between winter (W) and summer (S) season counts, the number of sites occupied and the % change between the number of sites between seasons.
|
Year |
Total Count W |
Total count S |
No of sites W |
No of sites S |
% change between no of sites |
|
2005 |
71700 |
2257 |
57 |
38 |
-50.0 |
|
2009 |
63472 |
452 |
46 |
29 |
-58.6 |
|
2010 |
14579 |
630 |
43 |
39 |
-10.3 |
|
2012 |
19631 |
1253 |
45 |
31 |
-45.2 |
|
2015 |
41189 |
608 |
46 |
42 |
-9.5 |
Figure 4: The difference in the number of sites occupied in summer and winter, and an exponential decline trendline in the number of sites occupied over 26 years.
Area of Occupancy (AOO) estimates – Criterion B
The ConR R package using BirdLasser data from 2016-2023 to produce a map gives an AOO of 4420 km2 (Lee 2024).
The report by Lee (2024) indicates that the predicted AOO using the ‘red’ package in R is preferred, which provides a minimum AOO of 257 664 km2. However, because no habitat filter was applied, results may be unreasonable for habitat specialists.
So I tried to refine the AOO estimates by calculating the mean of CWAC counts for all years for each site to determine the % of the Southern African population (2018 estimate of 120 000 – 200 000) that each site supports. 10 sites support over 10% of the minimum estimate of the Southern African population, and 84 sites regularly support over 1% of the population. The area of these sites (wetlands), and 4 other sites where breeding was attempted historically, was measured at a 2×2 km grid scale on Google Earth.
It is assumed that these 84 sites form the smallest essential network of specialist wetlands to support the regional population.
The 84 sites (and 4 considered important due to historical breeding attempts at those sites that are not surveyed) were mapped as essential sites for breeding, stopovers and important feeding sites (Figure 1 in the assessment). Kamfers Dam supported the largest regional subpopulation of between 30–50% of the lower bound of the Southern African population for several years.
Table 5. The estimated % of the subpopulations at the 84 key sites that support 34–57% of the total Southern African population and the sum of the area they cover.
|
Number of key sites |
% range of Southern African population |
AOO km2 |
|
13 (1 breeding site + 12 attempted breeding sites) |
18–31 |
< 100 |
|
10 |
26–43 |
<400 |
|
32 |
28–46 |
732 |
|
32 + 10 attempted breeding sites = 42 |
32–53 |
804 |
|
84 |
34–57 |
1360 |
The AOO estimate of 1360 km2 is not very different to the estimated AOO for the Lesser Flamingo in the 2015 Red List (1204 km2). It is not known how the AOO for the 2015 previous Red List assessment was determined.
Change in number of sites/locations – Criterion B
The AOO calculation includes the sites regularly occupied by the non-breeding and breeding population. The breeding population is suspected to be less than half of the non-breeding population (based on counts at Kamfers dam during six breeding events); and, therefore, cannot be assessed separately according to IUCN guidelines.
The year-on-year change in the mean number of sites occupied annually (based on the number of CWAC surveys) between 1998-2023 varied from -46% to 90% (mean 60%, range 26–64 sites/annum).
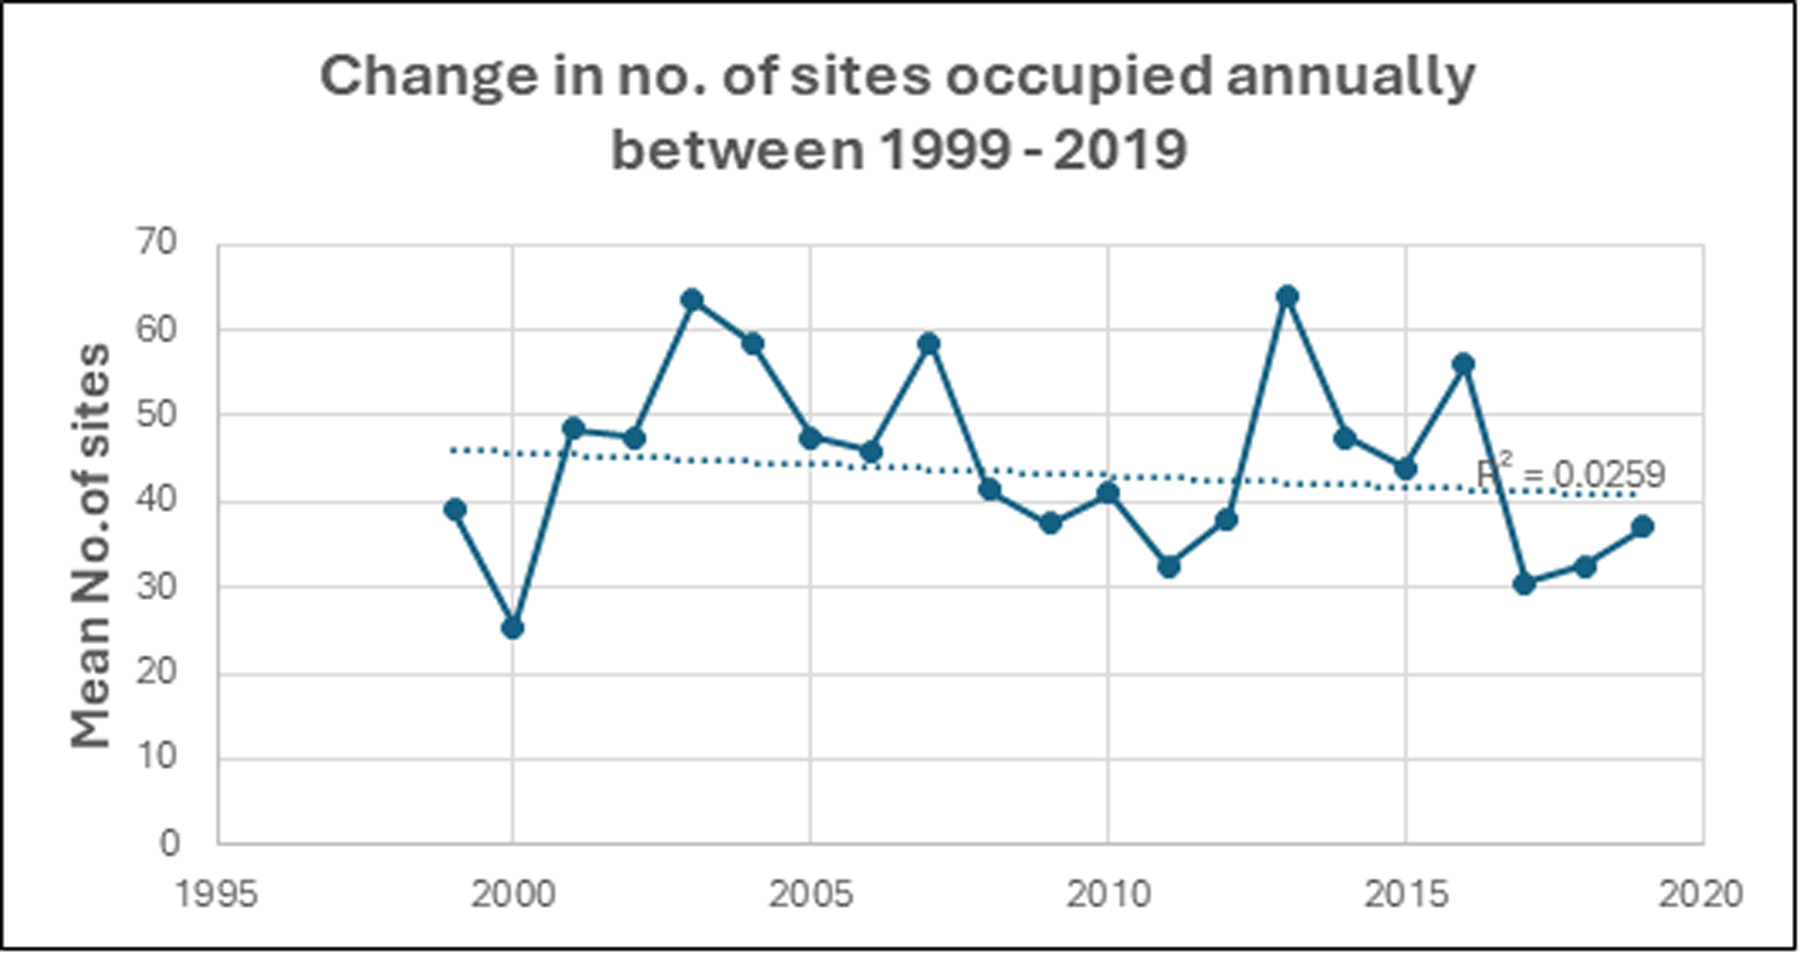
Figure 5: The graph illustrates the decline of -2.6% in the mean number of sites occupied/annum over the 21 years with the most surveys (exponential trendline).
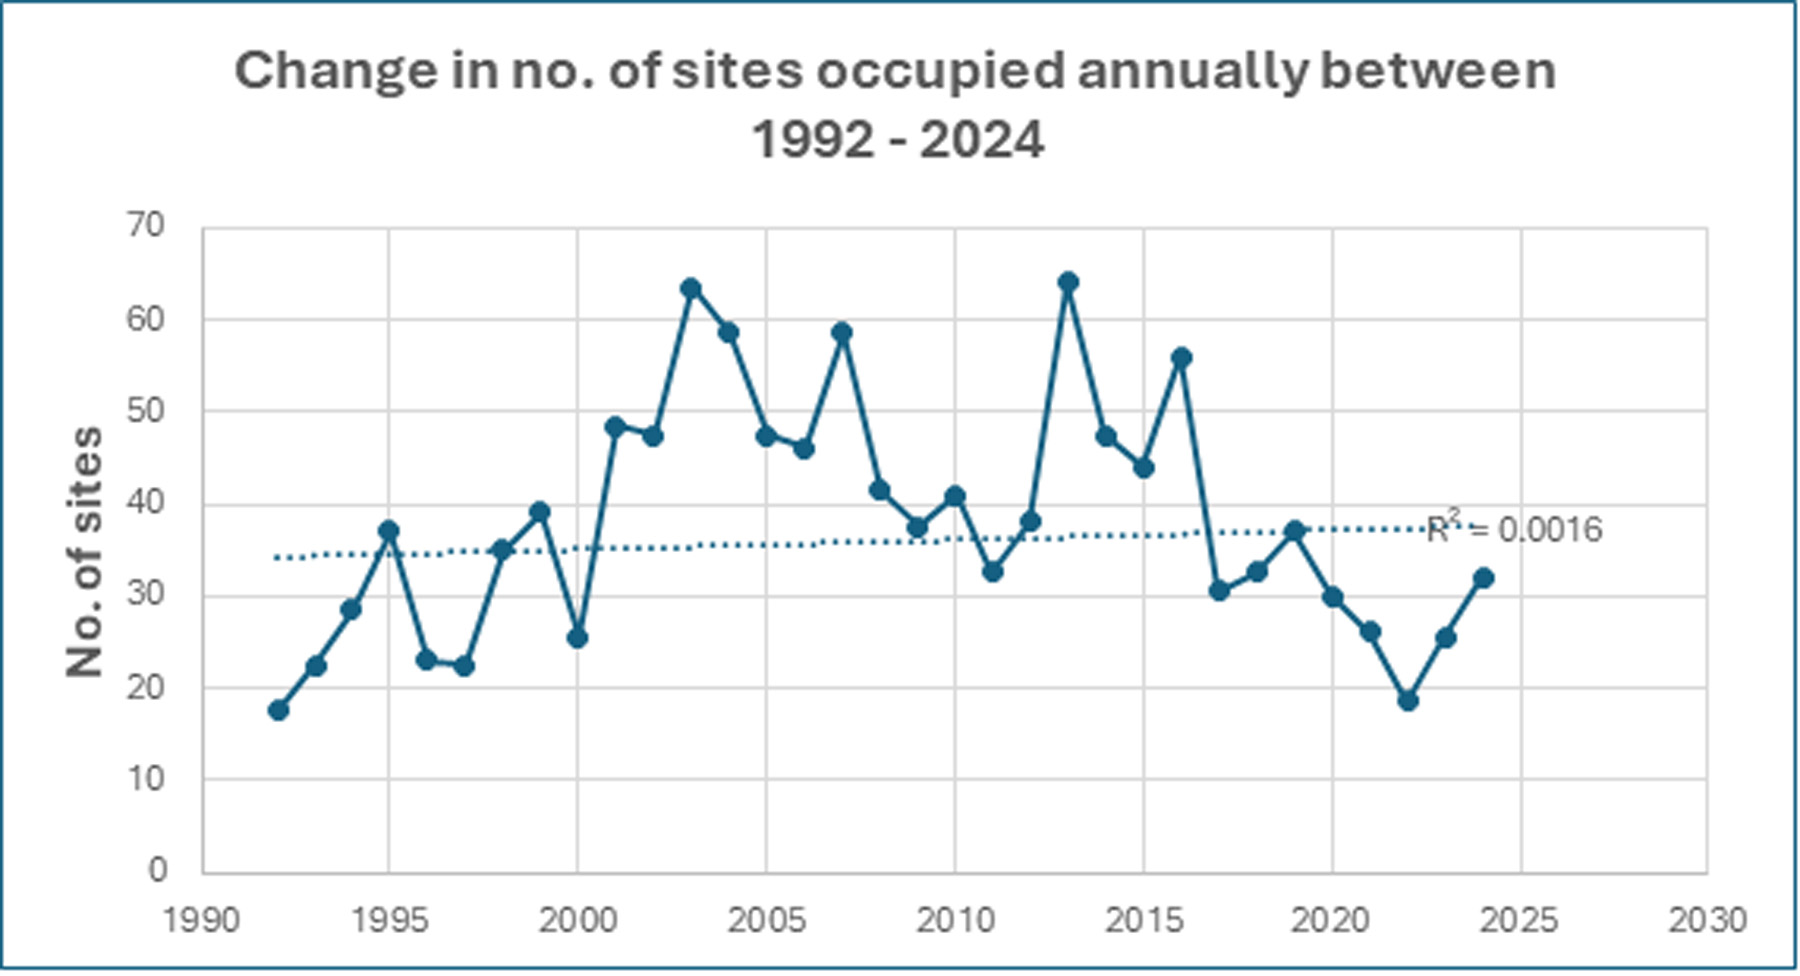
Figure 6: This graph illustrates that over two generations (1992-2024) the mean number of sites occupied/annum increased by 2.2%. These estimated changes are not extreme over a longer timeframe.
Citation
Anderson TA 2025. Lesser Flamingo. In: Lee ATK, Rose S, Banda S, Bezeng SB, Maphalala MI, Maphisa DH, Smit-Robinson H (eds), The 2025 Red Data Book of Birds of South Africa, Lesotho and Eswatini. Johannesburg, South Africa: BirdLife South Africa. Available at: https://www.birdlife.org.za/red-list/lesser-flamingo/
Our generous sponsors


